Geoscience Reference
In-Depth Information
a
b
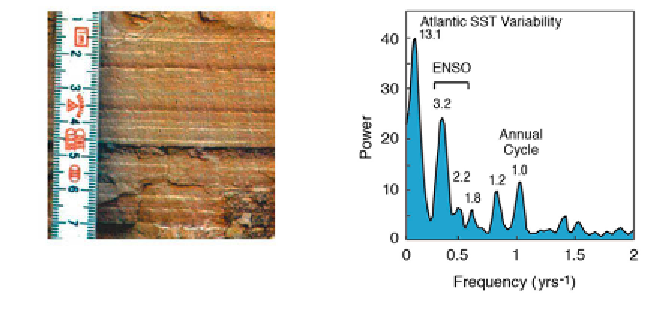
Fig. 5.1 a
Photograph of ca. 30 kyr-old varved sediments from a lake in the Andes of
Northwest Argentina. h e distribution of the source rocks and the interannual precipitation
pattern in the area suggest that the reddish-brown layers rel ect cyclic recurrences of enhanced
precipitation, erosion, and sediment input into the lake.
b
h e power spectrum of a red-
color intensity transect across 70 varves is dominated by signii cant peaks at frequencies of
ca. 0.076, 0.313, 0.455 and 1.0 yrs-1. h ese cyclicities suggest a strong inl uence of the tropical
Atlantic sea-surface temperature (SST) variability, the El Niño/Southern Oscillation (ENSO),
and the annual cycle that occurred 30 kyrs ago, similar to today's cyclicities (Trauth et al.
2003).
as a function of frequency (cross-spectral analysis) is then demonstrated in
Sections 5.3 and 5.4. Since most time series in earth sciences have uneven
time intervals, various interpolation techniques and subsequent methods
of spectral analysis are required, and these are introduced in Section 5.5.
Evolutionary power spectra to map changes in cyclicity through time
are demonstrated in Section 5.6. An alternative technique for analyzing
unevenly-spaced data is explained in Section 5.7. Section 5.8 introduces
the very popular wavelet power spectrum, which is able to map temporal
variations in the spectra in a similar way to the method demonstrated in
Section 5.6. Section 5.9 then introduces a non-parametric method to detect
abrupt transitions in central tendency and dispersion within time series.
h is chapter closes with an overview of nonlinear techniques, in particular
the method of recurrence plots (Section 5.10).
5.2 Generating Signals
A time series is an ordered sequence of values of a variable
x
(
t
) at certain
times
t
k
.