Geoscience Reference
In-Depth Information
a
b
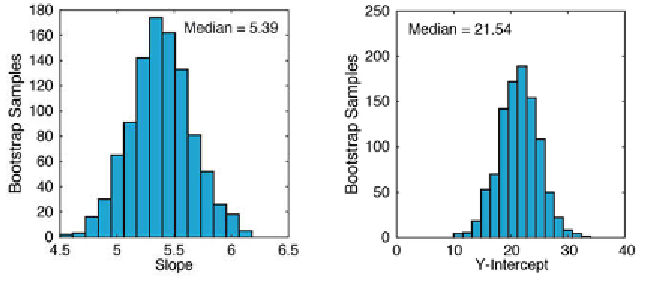
Fig. 4.6
Histogram of
a
, the i rst (slope of the regression line) and
b
, the second (
y
-axis
intercept of the line) regression coei cient, as estimated from bootstrap resampling. h e i rst
coei cient is well constrained, but the second coei cient shows a broad scatter.
ans =
5.3855
We use the median instead of the mean since we cannot expect the bootstrap
results to be Gaussian distributed. In contrast, the statistic of the second
coei cient shows a signii cant dispersion.
histogram(p_bootstrp(:,2),15)
median(p_bootstrp(:,2))
ans =
21.5374
h e true values, as used to simulate our data set, are 5.6 for the slope and
20 for the intercept with the
y
-axis, whereas the corresponding coei cients
calculated using
polyfit
were 5.3667 and 21.7607 (Section 4.3).
4.6 Jackknife Estimates of the Regression Coei cients
h e
jackknife
method is a resampling technique that is similar to the
bootstrap method. From a sample with
n
data points,
n
subsamples with
n
-1 data points are taken. h e parameters of interest, e.g., the regression
coei cients, are calculated for each of the subsamples. h e mean and
dispersion of the coei cients are then computed. h e disadvantage of this
method is the limited number of
n
subsamples: a jackknife estimate of the
regression coei cients is therefore less precise than a bootstrap estimate.
h e relevant code for the jackknife is easy to generate: