Geoscience Reference
In-Depth Information
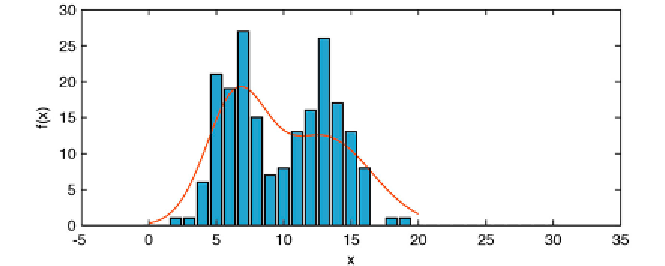
Fig. 3.15
Fitting Gaussian mixture distributions. As a synthetic example of Gaussian mixture
distributions we generate two sets of 100 random numbers, with means of 6.4 and 13.3,
and standard deviations of 1.4 and 1.8, respectively. h e
Expectation-Maximization (EM)
algorithm
is used to i t a Gaussian mixture distribution (solid line) with two components to
the data (bars).
Finally, we can plot the probability density function
y
on the bar plot of the
original histogram of
data
.
bar(v,n), hold on, plot(x,y,'r'), hold off
We can then see that the Gaussian mixture distribution closely matches the
histogram of the data (Fig. 3.15).
Recommended Reading
Ansari AR, Bradley RA (1960) Rank-Sum Tests for Dispersion. Annals of Mathematical
Statistics, 31:1174-1189. [Open access]
Bernoulli J (1713) Ars Conjectandi. Reprinted by Ostwalds Klassiker Nr. 107-108. Leipzig
1899
Dempster AP, Laird NM, Rubin DB (1977) Maximum Likelihood from Incomplete Data via
the EM Algorithm. Journal of the Royal Statistical Society, Series B (Methodological)
39(1):1-38
Fisher RA (1935) Design of Experiments. Oliver and Boyd, Edinburgh
Helmert FR (1876) Über die Wahrscheinlichkeit der Potenzsummen der Beobachtungsfehler
und über einige damit im Zusammenhang stehende Fragen. Zeitschrit für Mathematik
und Physik 21:192-218
Kolmogorov AN (1933) On the Empirical Determination of a Distribution Function. Italian
Giornale dell'Istituto Italiano degli Attuari 4:83-91
Mann, HB, Whitney, DR (1947) On a Test of Whether one of Two Random Variables is
Stochastically Larger than the Other. Annals of Mathematical Statistics 18:50-60
Miller LH (1956) Table of Percentage Points of Kolmogorov Statistics. Journal of the American
Statistical Association 51:111-121
O'Connor PDT, Kleyner A. (2012) Practical Reliability Engineering, Fit h Edition. John Wiley
& Sons, New York