Information Technology Reference
In-Depth Information
4.5
4.4
4.3
4.2
4.1
4
3.9
3.8
3.7
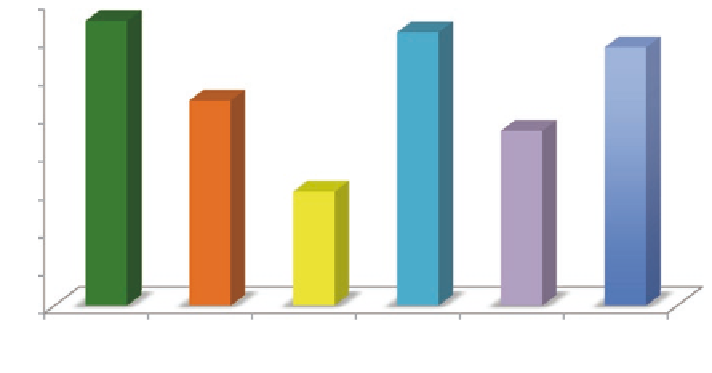
quality of
conctent
quality of
instruction
friendliness
usefulness
adaptivity
overall
rating
Fig. 4.1
Learners' general satisfaction about the programming tutoring system
successfully. As such, a classical pre-test and post-test methodology could not be
sufficient for the aimed evaluation. The value of factor p, which is derived dividing
the learner's degree of success in a particular domain concept with the times that
s/he needs to read the particular concept, was measured for group A and group B.
Then, the two average values were compared to assess the impact of the presented
fuzzy student model on the student's performance and progress.
According to Grubiši ´ et al. (2009) experiment used in the e-learning systems'
effectiveness evaluation change the independent variable (tutoring strategy) while
measuring the depended variable (effects on learning). In the presented work, the
experiment has one dependent variable and one independent variable with two val-
ues (two independent groups). The dependent variable is the factor p. The inde-
pendent variable is the groups (group A and group B). Due to the fact that the
experiment involves one dependent variable and one independent variable with
two levels, the two-independent sample t-test should be used to analyze the exper-
iment's data. The particular statistical test is used to determine whether the dif-
ferent average scores of two groups, represents a real difference between the two
populations, or just a chance difference in our samples (Carver and Nash 2009;
Norusis 2009). The results of the experiment are depicted in Table
4.3
.
However, the different averages scores can be occurred by chance or due to
differences on the education, knowledge level and abilities of the learners of the
two groups. The Levene's test for equality of variances is used to ensure that the
above results were not occurred randomly or due to differences of students' char-
acteristics of the two groups. According to the Levene's test, if the value “Sig.”
is less than 0.05, then the two variances are significantly different, otherwise the
variability in two groups is about the same. The “Sig.” value of the experiment is
0.282 (Table
4.4
). Therefore, the two variances are approximately equal. Then, the
value of “Sig. (2-tailed)” (Table
4.5
) is checked in order to infer if the two means
Search WWH ::

Custom Search