Database Reference
In-Depth Information
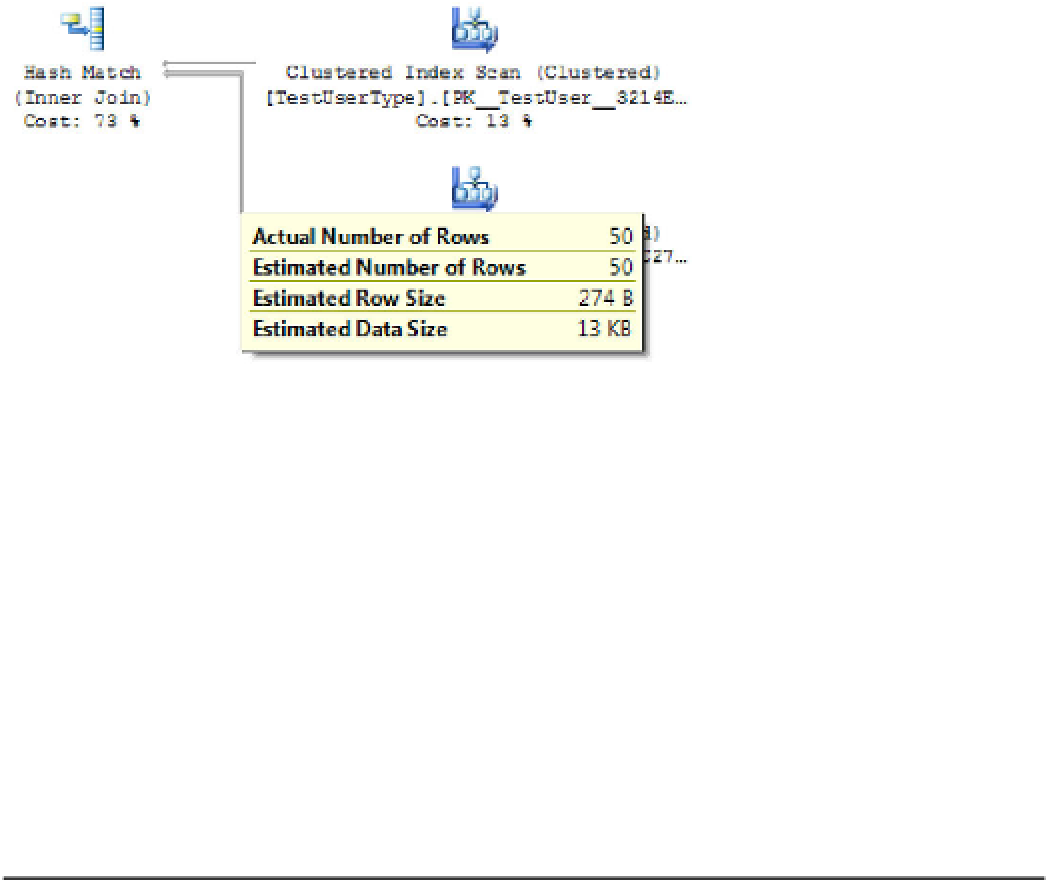
hovering your cursor on this line shows you that 50 records are being consumed by the
JOIN
operation
(see Figure 12-3). Also, you can see that a clustered index scan is being used to fetch data for both tables.
Finally, note that the hash match operation consumes 73% of resources of the entire statement; this
means it takes more time to
JOIN
the records than to read the data from disk.
Figure 12-3.
Verifying how many records are being consumed by a
JOIN
operator
In summary, the statement you've been working with has three potential issues:
•
Index scans
. An index scan is performed on both tables, causing more reads than
necessary.
•
Heavy operator processing
. The hash match operation is consuming most of the
processing time.
•
More reads than records returned
. As you can see from Figure 12-3, the statement
is processing 50 records but returning only 25. This may be a hint that you're
reading more records than necessary. However, this isn't always a problem in
itself—just something to keep an eye on.
■
Note
For those familiar with heap tables, SQL Azure doesn't allow them. If you intend to insert records into a
table, a primary key must be defined on the table.
You see shortly how indexing can help you tune this statement. But before leaving the topic of
execution plans, it's important to be familiar with a few more points:
•
Relative query cost
. Notice in Figure 12-2, shown earlier, that near the top of the
window, a query cost is displayed. This is a relative measure compared to all the
other statements being executed as a batch. In this example, the value is 100%
because it's the only statement. You should know, however, that this value can be
misleading. It's calculated dynamically by SQL Server Management Studio based
on estimated costs, not actual costs. As a result, this value is rarely accurate.