Graphics Reference
In-Depth Information
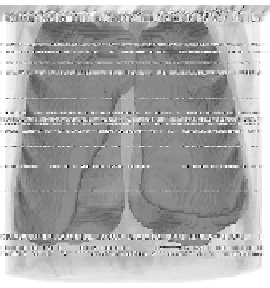
(a)
(b)
Fig. 10.17.
Comparison of 3D lung MRI image segmentation using (a) discrete min-
cut, and (b) continuous GMS. Note the unnatural staircase effect in the segmentation
of the lower left lung due to grid bias. Computation time was 2 minutes for min-cut
and 30 seconds for GMS using a 1Ghz Pentium
c
computer. (Images provided by
Ben Appleton.)
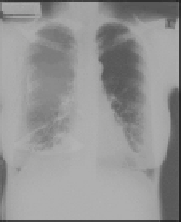
Fig. 10.18.
Application of GMS to 2D lung Xray image segmentation. Evolution
of the potential function used to find the global minimal surface. (Images provided
by Ben Appleton.)


Search WWH ::

Custom Search