Graphics Reference
In-Depth Information
90
80
70
60
50
40
30
20
10
0
0
0.1
0.2
0.3
0.4
0.5
0.6
0.7
0.8
0.9
1
Lambda
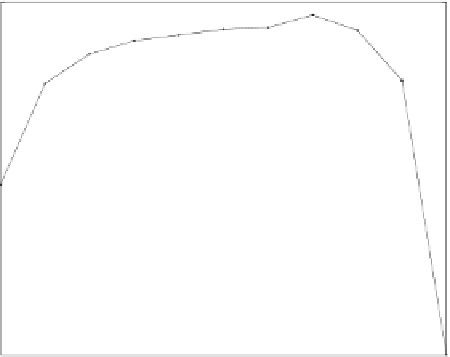
Fig. 10.3.
Plot of percentage of correct segmentations against
λ
for a set of images
consisting of known “dicult” images and randomly selected images.
65% of images, all points of greatest gradient actually lie upon the nucleus-
cytoplasm border, so these“easy” cell images will be correctly segmented with
λ
= 0. For the remaining 35% of images, a large gradient due to an artifact
or darkly stained chromatin will draw the contour away from the desired
border. As
λ
increases, the large curvatures necessary to admit these incorrect
configurations become less probable, as shown in Figure 10.4.
(a)
(b)
(c)
Fig. 10.4.
The effect of increasing
λ
.(a)
λ
=0
.
1, (b)
λ
=0
.
2, and (c)
λ
=0
.
5.
Comments on the Dynamic Programming Method
We show in [110] that the above segmentation method can be viewed as the
application of hidden Markov model techniques [138], where the transition


Search WWH ::

Custom Search