Biology Reference
In-Depth Information
miRNA159=0
Sequential updating
Attractor
Parallel updating
Nature
ABRS
Attractor
ABRS
AD
Fixed point 1
000000000000
000000011111
000000001000
000000010111
6.25%
56.25%
37.5%
000000000000
000000011111
None
0.5%
99.5%
1.45
5.40
Fixed point 2
Limit cycle 1
miRNA 159 = 1
Parallel updating
pCyCE_Cdk2
CyCE_Cdk2
Nature
Attractor
ABRS
Cdk2
Fixed point 1
000010000000
000010011011
000010001010
00001001000 1
000010010011
000010001011
000010011001
000010011010
000010010010
000010000011
000010001001
000010011000
0.12%
0.54%
10.6%
p27
Rbp-E2F
Rb-E2F
Fixed point 2
Limit cycle 1
E2F
miRNA159
pCycA_Cdk2
Limit cycle 2
26.6%
Rbp
Rb
CycA_Cdk2
Limit cycle 3
32.4%
Limit cycle 4
000010000010
000010000001
000010001000
000010010000
23.7%
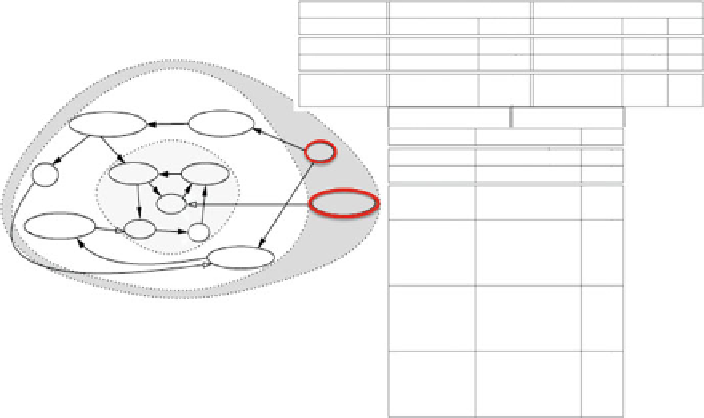
Fig. 4.7
Left
: Interaction signed digraph modeling the genetic regulation network controlling the
cell cycle in mammals (from Kohn
1999
).
Black
(resp.
white
)
arrows
represent activations (resp.
inhibitions), and the frontier genes are surrounded by a
red circle
.
Right
: network attractors, in
absence (
top
) and presence (
bottom
) of the microRNA miRNA 159, with their Attraction Basin
Relative Size (ABRS), equal to the proportion of initial conditions leading to the attractor, and in
the case of fixed configurations, their Attraction Diameter (AD), equal to the maximal distance in
the hypercube state space E between couples of states of their attraction basin, the gene state being
represented by 0 (gene in silence) or 1 (gene in expression) in the following order: p27, Cdk2,
pCyCE_Cdk2, CyCE_Cdk2, miRNA 159, pCycA_Cdk2, CycA_Cdk2, Rbp-E2F, Rb-E2F, E2F,
Rbp, and Rb
the expression of the ubiquitous tumor suppressor p53, because involved in many
cell functions (like cell cycle arrest, cellular senescence, apoptosis,
), plays a role
in carcinogenesis, and many human tumors present defects in the p53 control
pathway. Hence, we will examine the possible role of the microRNAs controlled
by p53 and those controlling it. Eventually, we will discuss their role in maintaining
the robustness of networks dedicated to a precise function during the evolution.
MicroRNAs are present in almost all genetic regulatory networks acting as
inhibitors targeting mRNAs, by hybridizing at most one of their triplets, hence
acting as translation factors by preventing the protein elongation in the ribosome.
The interaction graph associated to a genetic regulatory network can be inferred
from the experimental data and from the literature, e.g., from the genes
co-expression data, whose correlation networks are built by using for example
directional correlations or logical considerations about the observed fixed
configurations. These correlation graphs are after pruned or completed by orienting,
signing, and valuating their edges, hence creating new connected components.
Interaction graphs architecture contains motifs having positive and negative
circuits, a negative (positive) circuit being a closed path in the graph having an
odd (even) number of inhibitions. These circuits are connected to tree structures:
...
Search WWH ::

Custom Search