Biology Reference
In-Depth Information
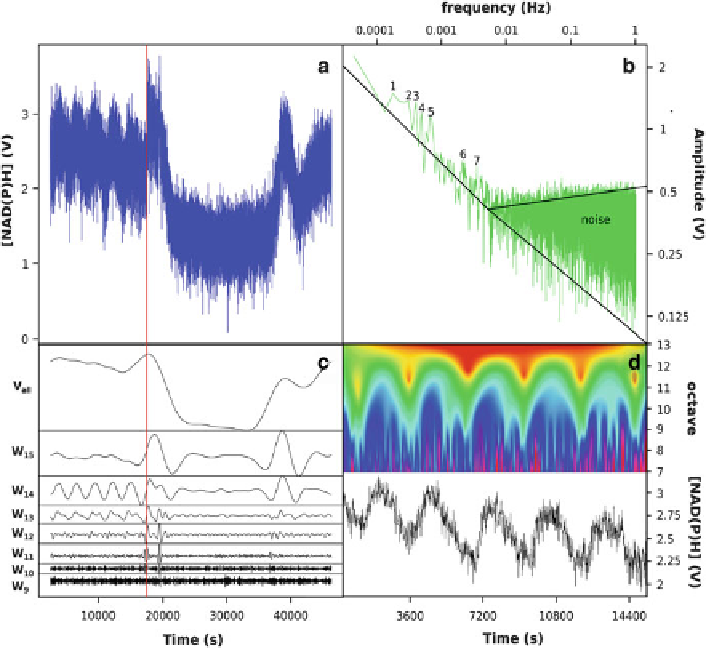
Fig. 12.9 Signal processing of the complex signal produced from continuous online measurement
of NAD(P)H initially sampled at 10 Hz (a). Discrete Fourier Transformation (
DFT
) spectra reveal
that the relation between the amplitude was linear until 0.05 Hz indicating scale-free dynamics in
this region (b); below this we observed a region of
coloured noise
. Discrete Wavelet Transforma-
tion (
DWT
) using the Daubechies wavelet was then used to process the signal where windows (
W
)
that had significant correlation were shown (c). The data was down-sampled to 1 Hz to reduce
computation cost. Continuous wavelet transformation (
CWT
) using the derivative of Gaussian
wavelet (
DOG
) of data down-sampled to 0.1 Hz reveals the finer grain temporal events of the
signal (d). The heat map intensity indicates the correlation of the signal to the wavelet. The
vertical
line
in (a) and (c) represents the time of (NH
3
)
2
S addition. (Sasidharan et al.
2012
)
the overall impact of the perturbation was shown over all temporal scales
(Sasidharan et al.
2012
). A similar effect is seen with 4
0
-Cl-diazepam, where addition
to whole yeasts of this inhibitor of IMAC, control of O
2
•
efflux from mitochondria,
attenuates the minute period oscillations of
ΔΨ
m
and NADP(H) reduction states
(Aon et al.
2007
,
2008
) as monitored optically. In a continuous culture this inhibitor
decreased the amplitude of oscillations of dissolved O
2
(D.B. Murray, unpublished
experiments). Furthermore, the period-lengthening effects of Li
+
and monoamine
oxidase (type A) inhibitors on the 40-min yeast clock (Salgado et al.
2002
)
echo results seen with a variety of circadian oscillators (Engelman et al.
1976
;
Search WWH ::

Custom Search