Biology Reference
In-Depth Information
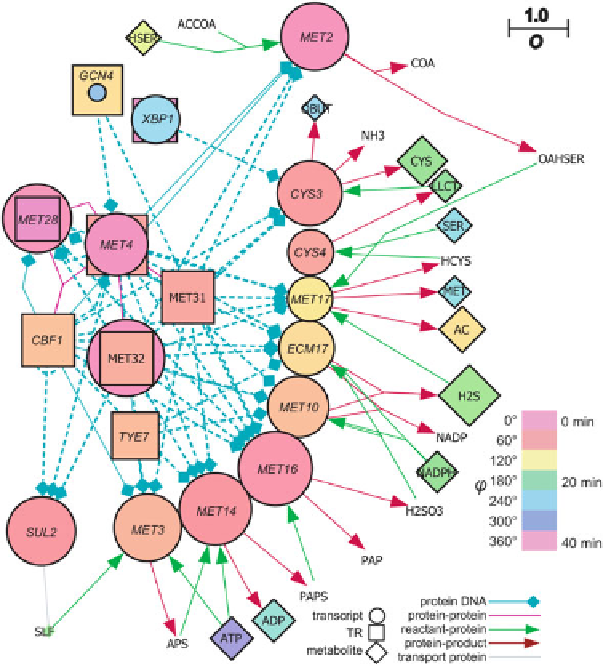
Fig. 12.2 Network derived for sulphur assimilation from the top oscillating (O
0.750)
transcripts and metabolites. The key provides a guide to the network.
Coloured circles
represent
transcript abundance,
diamonds
metabolites and
squares
represent the transcription factor activity.
If the transcription factor activity of a node was greater than its transcript concentration, the
square
was placed behind the
circle
, otherwise the
square
was placed in front of the
circle
. The nodes are
coloured
according to the phase angle (
), and the oscillation strength (
O
) is indicated by the size
of the node.
SLF
sulphate,
LLCT
cystathione,
HSER
homoserine,
OASER o
-acetylhomoserine,
OBUT
2-oxobutanoate,
AC
acetate (Murray et al.
2007
)
ϕ
defined the tight coupling between redox state and the regulation of oscillatory
dynamics. Cellular per-oxidative adducts, as measured by the levels of lipid
peroxidation products, oscillates out of phase with levels of dissolved O
2
(Kwak
et al.
2003
). Pulse addition at minima of dissolved O
2
of 100
M
N
-acetylcysteine
(which scavenges H
2
O
2
and hydroxyl radicals) perturbed the respiratory oscillation
and attenuated H
2
S production to 63 % of its normal amplitude in the next 40-min
cycle. Then the respiratory oscillation damped out, only returning after 20 h. The
non-toxic free radical scavenger, ascorbic acid as well as the inhibitor of catalase
(3-aminotriazole) or superoxide dismutase (N,N-diethyldithiocarbamate) suggest
that endogenously produced reactive oxygen species play a role in intracellular
μ
Search WWH ::

Custom Search