Biology Reference
In-Depth Information
a
2D
RD-RIRR model
mito
(j,k-1)
S
O
2
.-
S
D
mito
(j-1,k)
mito
(j,k)
mito
(j+1,k)
O
2
.-
O
2
.-
D
S
S
O
2
.-
mito
(j,k+1)
b
Experiment
Model
120
0.20
30 ms
75 ms
180 ms
300 ms
f
410 ms
500 ms
0
0
Depolarization
Repolarization
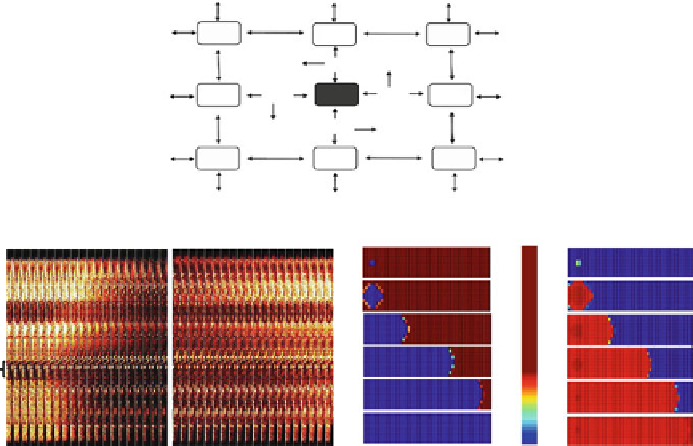
Fig. 5.8 Scheme of the RD-RIRR mitochondrial network model. In the two-dimensional
RD-RIRR model neighboring mitochondria are chemically coupled with each other through
superoxide anion, O
2
.
, diffusion.
Light
and
dark gray
indicate polarized and depolarized
mitochondria, respectively.
Arrows
indicate release of O
2
.
and its effect on mitochondrial
neighbors. D stands for O
2
.
diffusion, and S for O
2
.
scavenging by Cu,Zn SOD and catalase.
Reproduced from Zhou, Aon, Almas, Cortassa, Winslow, O'Rourke (2010) PLoS Computational
Biology 6(1): e1000657. doi:10.1371/journal.pcbi.1000657
networks (see Box
5.2
). The nodes of the RD-RIRR network are comprised of
models of individual mitochondria that include a mechanism of ROS-dependent
oscillation based on the interplay between ROS production, transport, and scaveng-
ing, and incorporating the tricarboxylic acid (TCA) cycle, oxidative phosphoryla-
tion, and Ca
2+
handling. Local mitochondrial interaction is mediated by O
2
.
diffusion and the O
2
.
-dependent activation of IMAC (Fig.
5.8a
).
In a 2D network composed of 500 mitochondria, model simulations reveal
ΔΨ
m
depolarization waves similar to those observed when isolated guinea pig
cardiomyocytes are subjected to local
laser flash or antioxidant depletion
(Fig.
5.8b
).


Search WWH ::

Custom Search