Agriculture Reference
In-Depth Information
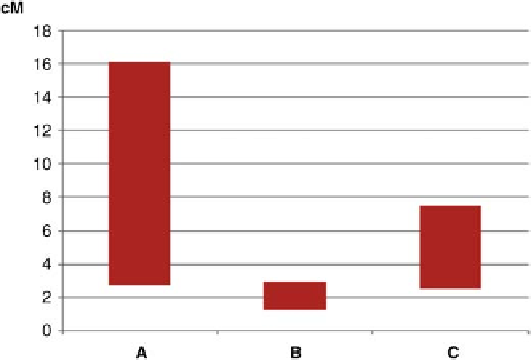
Fig. 2.1.
Range in the average rates of LD decay to nonsigni
cance across genetic
(centiMorgan (cM) on the
y
-axis) distances in three different types of crops or plant species
(inbreeding (A), outcrossing (B) and clonally-propagated (C), on the
x
-axis) studied for
association mapping based on data in Tables 2.2 and 2.3.
different parts of the genome of the crop. The variability in rate of LD
decay for various inbreeding (autogamous), outcrossing (allogamous),
and highly heterozygous vegetative (clonal) crops is shown in Fig. 2.1.
III. METHODS OF ASSOCIATION GENETICS
To accomplish association genetics analysis there are
ve steps that one
should follow (as shown in Fig. 2.2):
1. Select the individuals for the population (sampling).
2. Genotype the population for genome-wide (required) and candi-
date (optional) markers.
3. Analyze population structure based on the genotyping.
4. Characterize the population phenotypically for the trait of interest.
5. Calculate association between genotypes and phenotypes.
A. Sampling or Selection of Individuals for Population Analysis
The selection of the population is a key element in the process of AM. As
LD is the basis for an association study, the more recombination we can