Global Positioning System Reference
In-Depth Information
A common method used to measure oscillator stability is based on the instanta-
neous fractional frequency deviation from the nominal frequency
0
given by
φ
πν
()
yt
=
2
0
The power-law spectral densities of the five random frequency noise processes
mentioned in Section B.1 can be represented in the frequency domain by the sum of
five independent noise processes as [1]:
+
∑
2
()
α
Sf
=
hf
for
0
<
f f
<
y
α
h
α
=−
2
=
0
for
ff
≥
h
where:
h
α
=
constant
α =
integer
f
h
=
high-frequency cutoff of an infinitely sharp lowpass filter
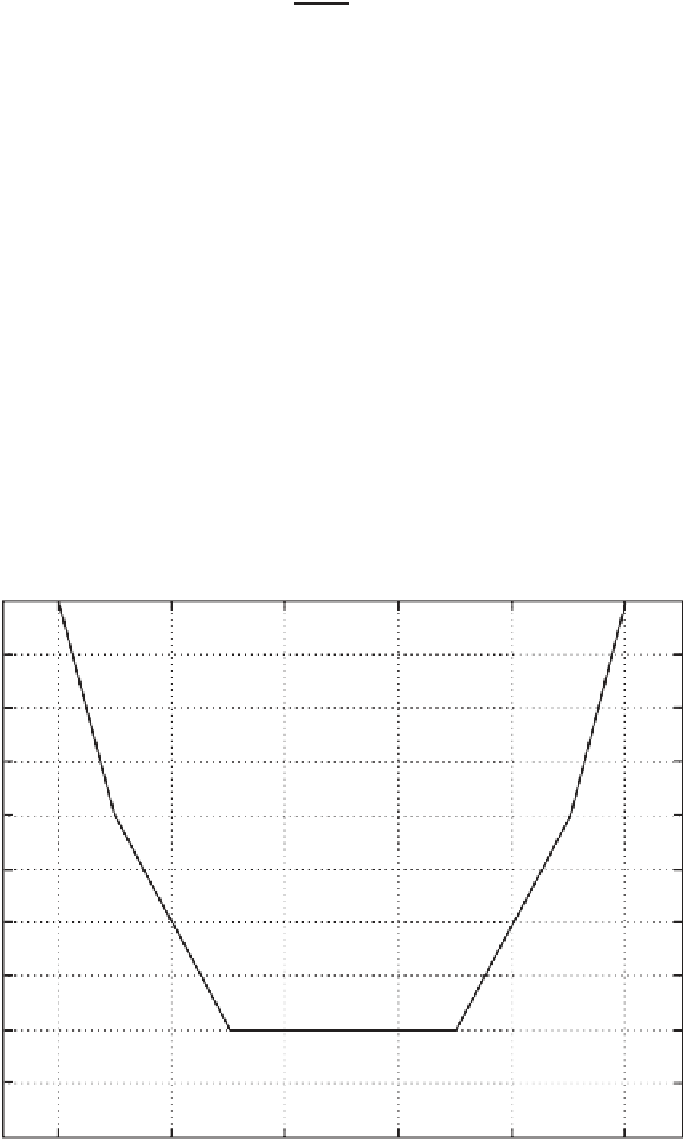
This power spectral density is visually represented in Figure B.1 for the five ran-
dom frequency noise processes: random walk frequency, flicker frequency, white
frequency, flicker phase, and white phase.
White phase
f
−
2
Random walk frequency
f
2
Flicker phase
Flicker frequency
f
1
f
−
1
White frequency
f
0
Log frequency, f
Figure B.1
Power spectral densities for five random frequency noise processes: random walk fre-
quency, flicker frequency, white frequency, flicker phase, and white phase.


Search WWH ::

Custom Search