Global Positioning System Reference
In-Depth Information
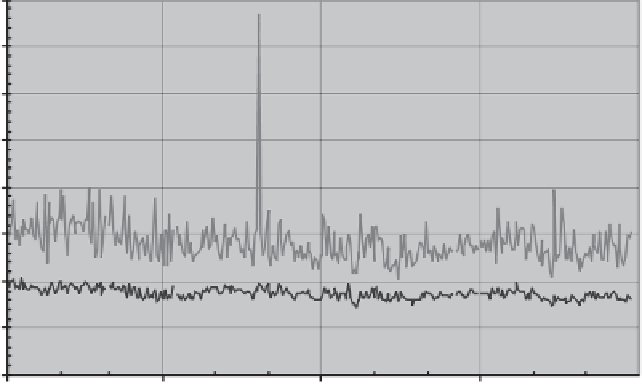
Calendar year 2003
40
Average daily global performance:
9 ns (95%)
35
30
Average worst site performance:
14 ns (95%)
25
20
15
10
5
0
January-03
April-03
July-03
October-03
January-04
Date calendar year 2003
95% NAV user time transfer error -
- global median
95% NAV user time transfer error -
- worst site
ANALYSIS NOTES
- All-in-view PPS dual-frequency
NAV receiver with five-degree mask
- 4 ns RMS error in knowledge of
bias between GPS time and
USNO UTC
- 80 cm (1 ) receiver thermal noise
- One minute samples over
24 hours, 2 2 degree equally
spaced global grid
σ
×
Figure 7.35
Global trend in dynamic GPS time transfer performance [relative to UTC (USNO)].
ensemble average of pseudorange residuals from all satellites in view, so it is
independent of the position solution geometry.
We have seen throughout the discussion in this section that GPS provides a
global PNT capability that provides predictable and consistent performance. We
have also seen that GPS performance can vary widely across users and their operat-
ing environment. Measuring performance under such a varied set of conditions and
on such a scale is impractical, so we established a framework that supports assess-
ments using a combination of measurements and estimates. To close the discussion,
Table 7.17 summarizes the range of typical performance for a variety of receiver
types under current GPS operational conditions. Analysis notes are included after
the table to provide some context to the representative performance values.


Search WWH ::

Custom Search