Global Positioning System Reference
In-Depth Information
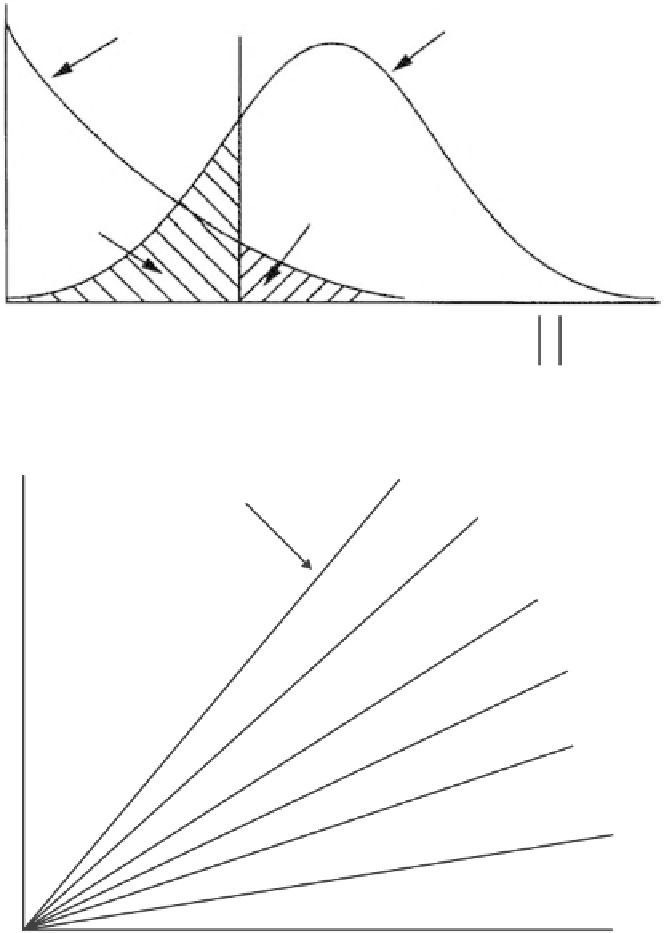
Probability
density
function
2 DOF chi-square density
2 DOF noncentral chi-square density
P
FA
P
miss
Normalized chi-square threshold
2
p
σ
Figure 7.21
Chi-square density functions for two degrees of freedom.
SV 3
Estimated
horizontal
position
error
Slope
max
SV 1
SV 6
SV 2
SV 5
SV 4
Test statistic |p|
Figure 7.22
Characteristic slopes for six visible satellites.
For a given position error, the satellite with the largest slope has the smallest test
statistic and will be the most difficult to detect. Therefore, there is a poor coupling
between the position error to be protected and the magnitude of the parity vector
that can be observed when a bias actually occurs in the satellite with the maximum
slope.
The oval-shaped
cloud of data
shown in Figure 7.23 is a depiction of the scatter
that would occur if there were a bias on the satellite with the maximum slope. This
bias is such that the fraction of data to the left of the detection threshold is equal to
the missed detection rate. Any bias smaller than this value will move the data cloud


Search WWH ::

Custom Search