Global Positioning System Reference
In-Depth Information
1.0
0.8
σ
S
σ
L
σ
S
σ
L
=0
values of 0, 0.25, 0.5 and 1.0
0.6
0.4
σ
S
σ
L
=1
0.2
0.0
2.5
1.0
2.0
0.0
0.5
1.5
k
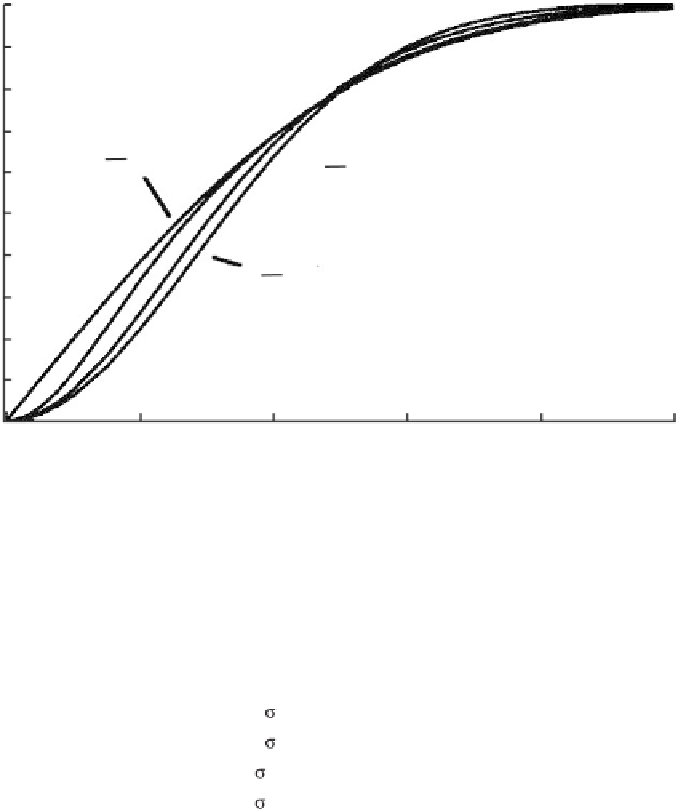
Figure 7.7
Cumulative distribution of radial error for various values of
σ
S
/
σ
L
for a two-dimensional
Gaussian random variable.
Table 7.5
Approximate Formulas for the
Magnitude of the Horizontal Error
Approximation Formula*
Probability Range
CEP
50
≈
0.75 HDOP
0.43-0.54
UERE
CEP
80
≈
1.28 HDOP
0.80-0.81
UERE
CEP
90
≈
1.6 HDOP
0.89-0.92
UERE
0.95-0.98
CEP
95
≈
2.0 HDOP
UERE
* CEP
xx
is defined as the radius of the circle that when centered at
the error-free location includes xx% of the error distribution.
Hence, CEP
50
= CEP.
CEP
12
≈⋅
075
.
HDOP
⋅
σ
UERE
=××=
075
.
1
14
.
11
.
m
50
CEP
≈⋅
.
HD
OP
⋅
σ
σ
=
12875
.
×
1
×
14
.
=
18
.
m
(7.66)
80
UERE
CEP
≈⋅
20
.
HDOP
⋅
=
20
.
××
114 28
.
=
.
m
95
UERE
For applications where three-dimensional error distributions are of interest, one
final commonly used metric is
spherical error probable
(SEP), which is defined as the
radius of a sphere centered at the true position that contains 50% of the measured
positions.
7.3.3 Weighted Least Squares (WLS)
Oftentimes, the UEREs among the visible satellites are not well described as being
independent and identically distributed. In such circumstances, the least-squares


Search WWH ::

Custom Search