Global Positioning System Reference
In-Depth Information
P (z) = pdf of
noise only
P (z) = pdf of noise
with signal present
n
s
V
t
V
t
(a)
(b)
V
t
V
t
(c)
(d)
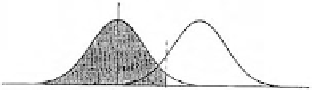
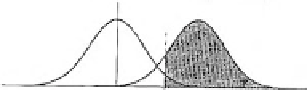
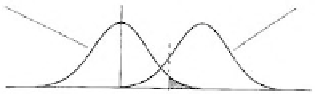
Figure 5.35
Pdfs for a binary decision: (a) shaded area represents probability of false alarm, (b)
shaded area represents probability of false dismissal, (c) shaded area represents probability of
detection, and (d) shaded area represents probability of correct dismissal.
example where both pdfs are shown. The pdf for noise with no signal present,
p
n
(
z
),
has a zero mean. The pdf for noise with the signal present,
p
s
(
z
), has a nonzero
mean. The single trial threshold is usually based on an acceptable single trial proba-
bility of false alarm,
P
fa
. For the chosen threshold,
V
t
, any cell envelope that is at or
above the threshold is detected as the presence of the signal. Any cell envelope that is
below the threshold is detected as noise. There are four outcomes of the single trial
(binary) decision processes illustrated in Figure 5.35, two wrong and two right. By
knowing the pdfs of the envelopes, the single trial probability can be computed by
an appropriate integration with the threshold as one limit and infinity as the other.
These integrations are shown as the shaded areas in Figure 5.35. The two statistics
that are of most interest for the signal detection process are the single trial probabil-
ity of detection,
P
d
, and the single trial probability of false alarm,
P
fa
. These are
determined as follows:
∞
∫
P
=
p dz
(5.37)
d
s
V
t
∞
∫
P
=
p dz
(5.38)
fa
n
V
t
where:
p
s
(
z
)
=
pdf of the envelope in the presence of the signal
p
n
(
z
)
=
pdf of the envelope with the signal absent
To determine these pdfs, assume that
I
and
Q
have a Gaussian distribution.
Assuming that the envelope is formed by
2
2
I
+
Q
, then
p
s
(
z
) is a Ricean distribu-
tion [17] defined by:


Search WWH ::

Custom Search