Global Positioning System Reference
In-Depth Information
R()
PN
τ
A
2
(N
1)T
(N
1)T
c
−
+
−
−
T
c
T
c
(N
1)T
c
(N+1)T
c
−
−
A
2
c
N
NT
−
0
c
NT
c
τ
(a)
S()
PN
f
A
2
A
2
2
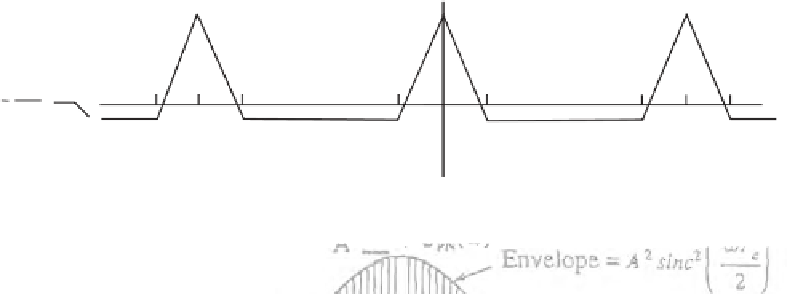
Envelope =
sinc
(
π
fT
c
)
f
→
3
2
1
0
1
2
3
−
−
−
T
c
T
c
T
c
T
c
T
c
T
c
A
2
N
2
dc component =
1
Line spacing =
NT
c
(b)
Figure 4.4
(a) The autocorrelation function of a DSSS signal generated from a maximum-length PRN
sequence, and (b) its line spectrum.
1/
NT
c
(Hz), of the line spectrum decreases proportionally, so that the power spec-
trum begins to approach a continuous spectrum.
Next consider the general baseband DSSS signal that uses the arbitrary symbol
g
(
t
):
∞
∑
()
(
)
st
=
a g t
−
kT
(4.11)
k
c
k
=−∞
If the PRN code values {
a
k
} are assumed to be generated as a random coin-flip
sequence, then the autocorrelation function for this signal may be found by taking
the mean value of (4.5), resulting in:
∞
∫
()
() (
)
R
τ
=
g t g
∗
t
−
τ
dt
(4.12)
−∞
Although data was neglected in (4.11), its introduction does not change the
result for a nonrepeating coin-flip sequence. Using this result, along with (4.6) for
power spectral density, we can express the autocorrelation function and power spec-
trum for unit-power BPSK-R signals, for which
1
T
,
0
≤≤
t
T
()
g
t
=
(4.13)
c
c
BPSK
−
R
0
,
else
ere


Search WWH ::

Custom Search