Graphics Reference
In-Depth Information
In the first chapter, you will recall the proposed definition of data visualization and
how it separated the idea of representation and presentation of data. We see these as
separate dimensions of our design task:
•
Data representation
: This is the foremost layer, how we give form to our
data through the use of "visual variables" to construct chart or graph types.
•
Data presentation
: This is the delivery format, appearance, and synthesis of
the entire design. It concerns the layers of color use, interactivity, annotation,
and the arrangement of all elements.
Some helpful tips
Before we commence our design thinking, here are a few useful tactics to help you
move smoothly through this process and achieve the best outcome:
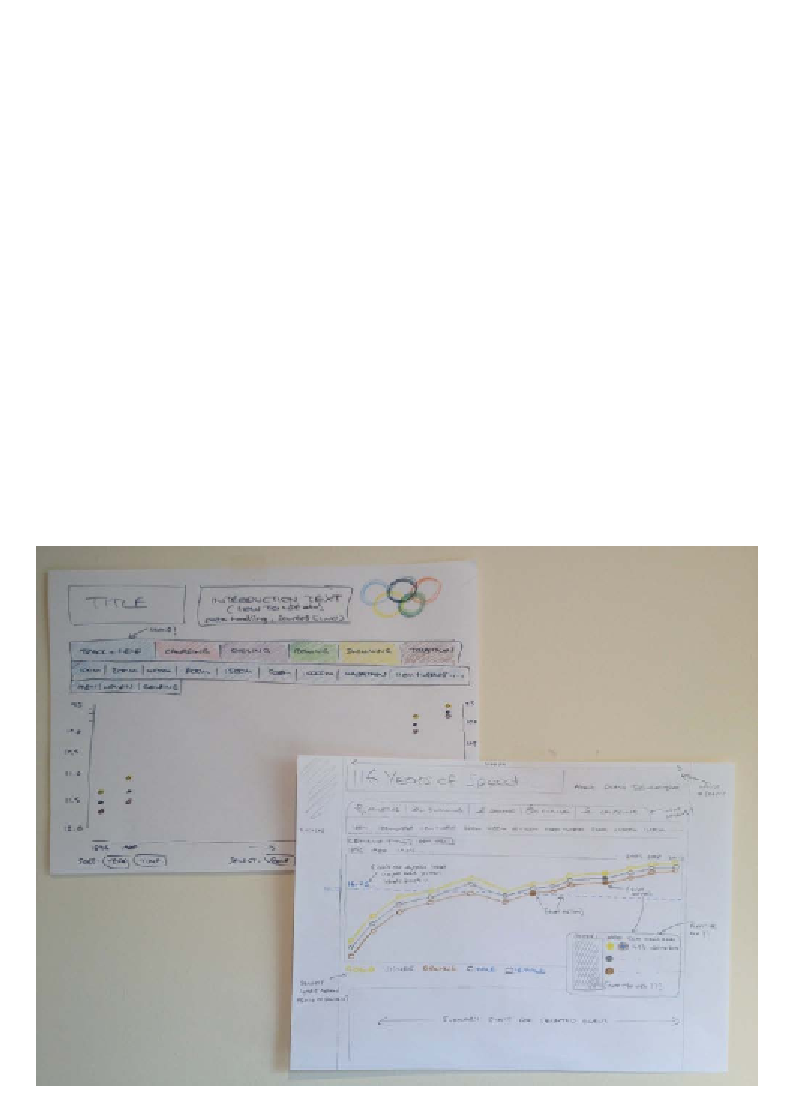
•
Sketching
: Drawing out rough ideas on paper is a really good discipline to
get into before you go anywhere near a computer. It doesn't matter if it is on
the back of a beer mat, on a white board, or in a beautiful portfolio pad, try
to sketch out your thoughts and concepts in order to download those ideas
floating around in your mind. This is shown in the following screenshot:
Search WWH ::

Custom Search