Graphics Reference
In-Depth Information
• Population figures to contextualize the achievements, maybe even sporting
participation figures if they were recorded
• Historical milestones of socio-political and geo-political issues to help us
appreciate the status of the different countries at these key points in time
• You might look to bolster the ingredients of your visualization design
resources with national flags' image files or URL links to national
Olympic associations
Whether we could obtain these additional data items is another matter and they may
not even help with our stories. But it is always good to let your imagination roam
and explore ideas for content that could really enhance your work.
Our data is now in good shape. Next up, we look to develop our editorial focus,
specifically considering the following:
• What initial sparks of curiosity crossed our minds when we were given the
brief and initially saw the data?
• What dimensions of analysis do we think might be of interest or relevance
about this subject matter?
• What data questions will we seek to answer in our visualization design?
To refine our focus we need to commence our visual analysis work to explore
our dataset and see what comparisons, trends, patterns, and relationships we can
identify. Out of this we will hope to unearth some interesting stories to tell.
Given we have a small dataset with only two variables we shouldn't need to embark
on too much varied visual analysis.
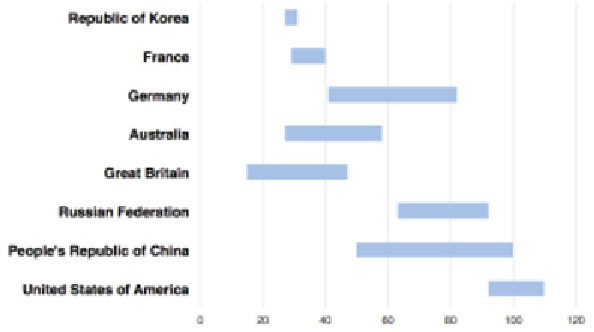
The first graphic takes a look at the variation of medal winning across the years,
showing the range of totals for each country using a floating bar chart:


Search WWH ::

Custom Search