Graphics Reference
In-Depth Information
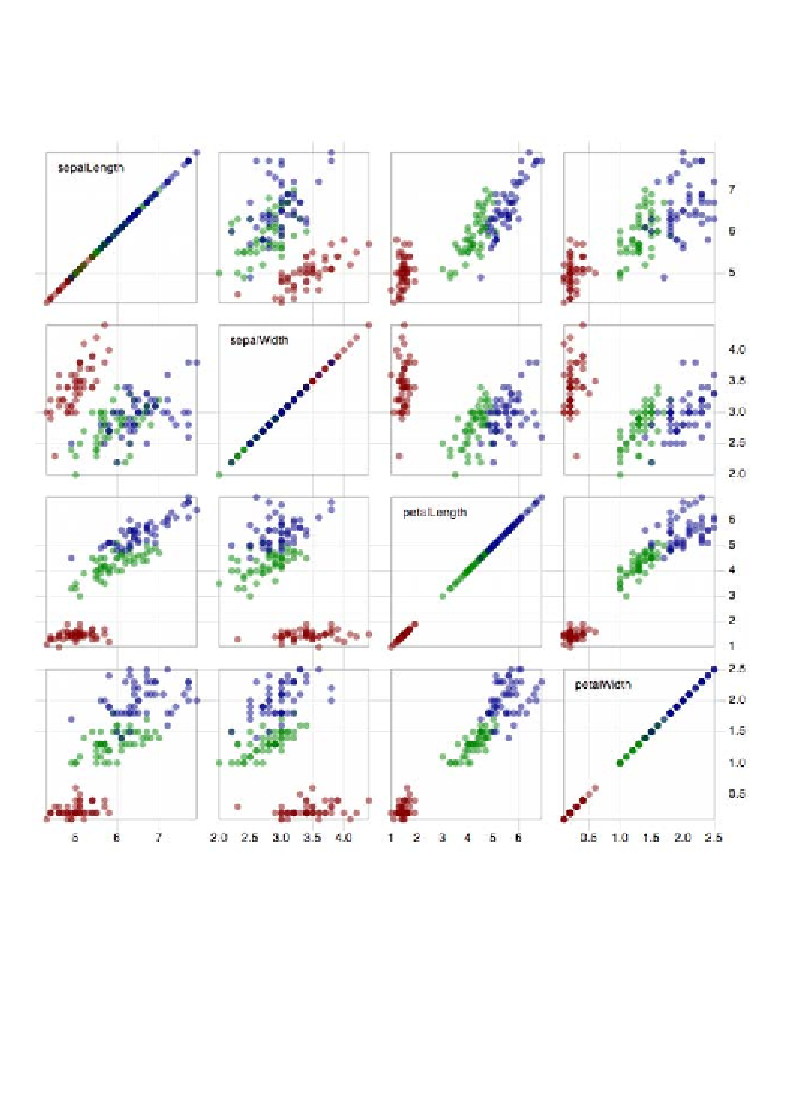
In the following image, we see a
scatterplot matrix
visualization: a method used
to reveal correlations across a multivariate dataset, enabling the eye to efficiently
scan the entire matrix to quickly identify variable pairings with strong or weak
relationships. This is a perfect example of an exploratory visualization design:
Image from "Scatterplot Matrix" (
http://mbostock.github.com/d3/ex/splom.html
),
created by Mike Bostock.
Exploratory visualizations are not limited to being interactive. Visual analysis can
be facilitated through static portrayals of data. The previous example is actually
interactive but a static version would still offer a discovery of the relationships and
patterns of the dataset.
Search WWH ::

Custom Search