Graphics Reference
In-Depth Information
Remember in
Chapter 1
,
Context of Data Visualization
(you should do, after all it's
only been a few pages) we saw a definition for data visualization that proposed
the overall aim as being to "amplify cognition" or, in other words, make someone
feel better informed. That was a deliberately equivocal aim because there are many
different motivations and reasons for creating a data visualization.
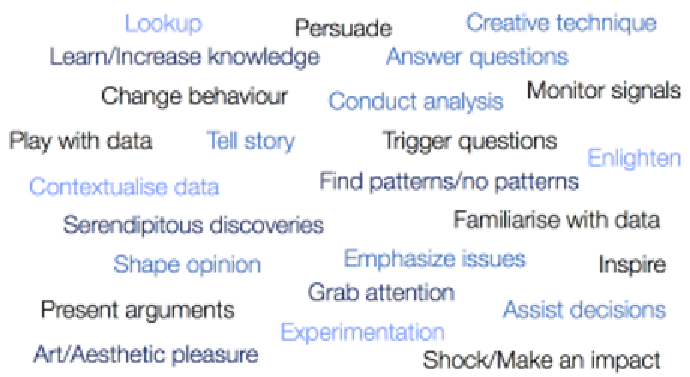
Consider the following sample collection of phrases, which articulate a variety of
viable intentions behind creating a visual representation of data:
If we look closely at the verbs and the overall language being used, we can start to
recognize quite a range of differing effects that might be sought.
For example, a visualization to assist with the monitoring of signals or facilitating
a visual lookup of data will be very different from a design that is intended to grab
attention or change behavior. Similarly, presenting arguments and telling a story is
a very different setting to conducting analysis or 'playing' with data.
What we have here is evidence of different dimensions of intent. Identifying your
intended effect means deciding what you're aiming to achieve and how you're going
to achieve it.
At the root of this is an appreciation of your target audience, one of the most
important considerations we have to take into account. During this initial
definition and scoping work, it is crucial to profile your intended readers/users.


Search WWH ::

Custom Search