Graphics Reference
In-Depth Information
Excel can also be used to serve up chart images for exporting to other applications
(such as Illustrator, see later). Search online for the work of Jorge Camoes (
http://
www.excelcharts.com/blog/
), Jon Peltier (
http://peltiertech.com/
), and
Chandoo (
http://chandoo.org/
) and you'll find some excellent visualization
examples produced in Excel.
Tableau
(
http://www.tableausoftware.com/
) is a very powerful and rapid
visual analytics application that allows you to potentially connect up millions
of records from a range of origins and formats. From there you can quickly
construct good practice charts and dashboards to visually explore and present
your data. It is available as a licensed desktop or server version as well as a
free-to-use public version.
Tableau is particularly valuable when it comes to the important stage of data
familiarization. When you want to quickly discover the properties, the shapes
and quality of your data, Tableau is a great solution. It also enables you to create
embeddable interactive visualizations and, like Excel, lets you export charts as
images for use in other applications.
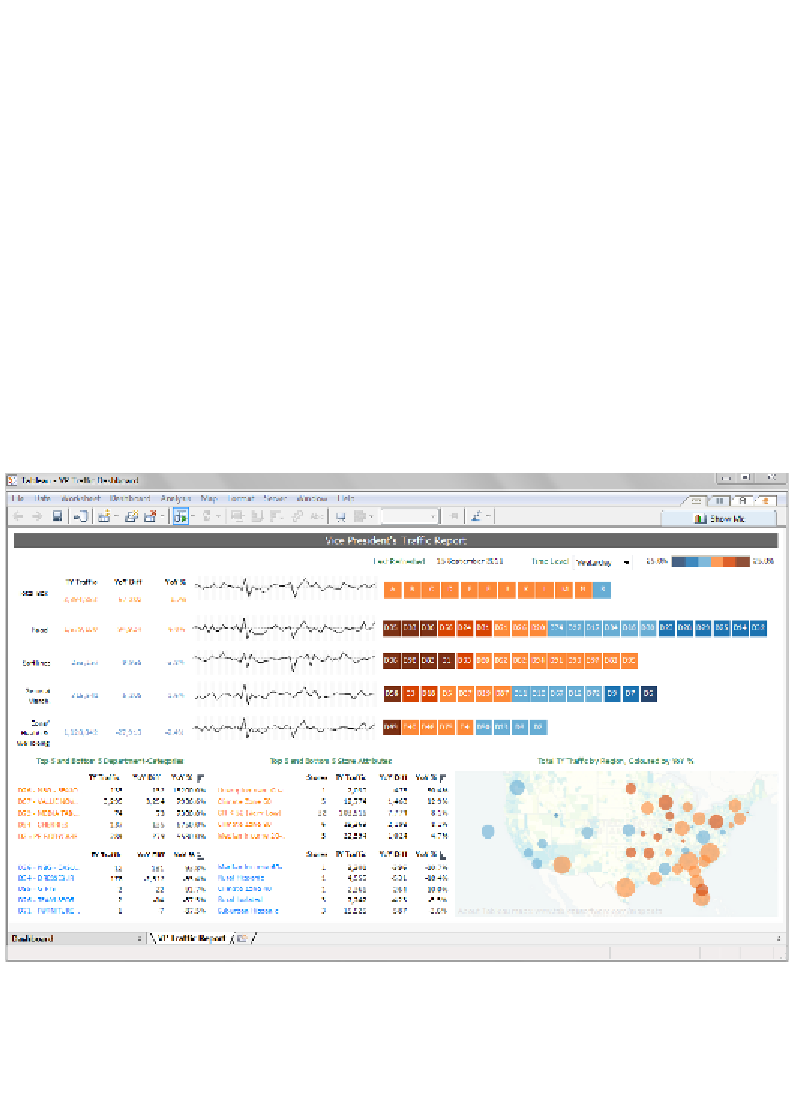
Sample screenshot of Tableau's charting capabilities

Search WWH ::

Custom Search