Graphics Reference
In-Depth Information
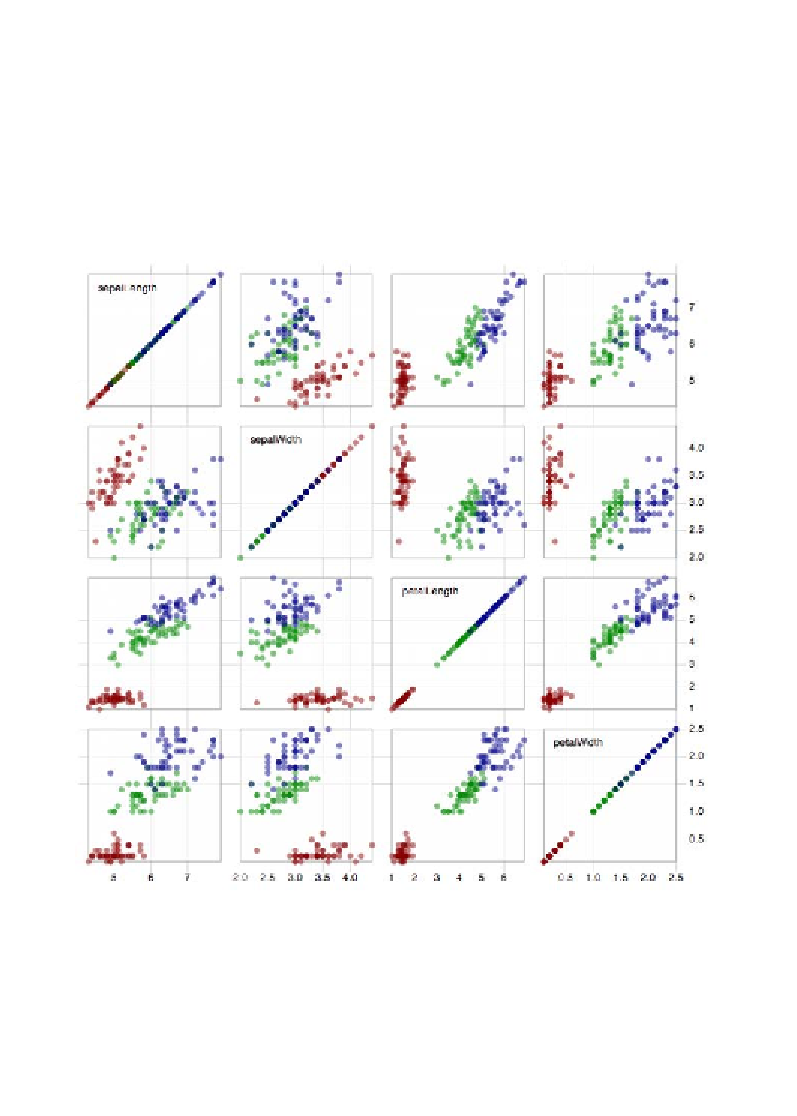
Scatter plot matrix
Data variables
: 2 x quantitative, 2 x categorical.
Visual variables
: Position, color-hue.
Description
: Similar to the small multiples chart that we saw earlier, a scatter plot
matrix takes advantage of the eye's rapid capability to spot patterns across multiple
views of the same type of chart. In the following case, we have a panel of multiple
combined scatter plots:
Image from "Scatterplot Matrix" (
http://mbostock.github.com/d3/ex/splom.html
),
created by Mike Bostock
Heatmap (or matrix chart)
Data variables
: Multiple x categorical, 1 x quantitative-ratio.
Visual variables
: Position, color-saturation.
Search WWH ::

Custom Search