Graphics Reference
In-Depth Information
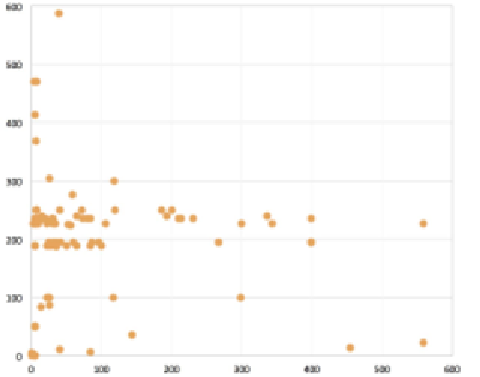
Bubble plot
Data variables
: 2 x quantitative, 2 x categorical.
Visual variables
: Position, area, color-hue.
Description
: A bubble plot extends the potential of a scatter plot through multiple
encoding of the data mark. In the following example, we see the marks becoming
circles of varying size and then colored according to their categorical relationship.
Often, you will see a further layer of time-based data applied to convey motion with
the plot animated over time.
Image from "How Much Money do the Movies we Love Make?"
(
http://vallandingham.me/vis/movie/
), created by Jim Vallandingham


Search WWH ::

Custom Search