Graphics Reference
In-Depth Information
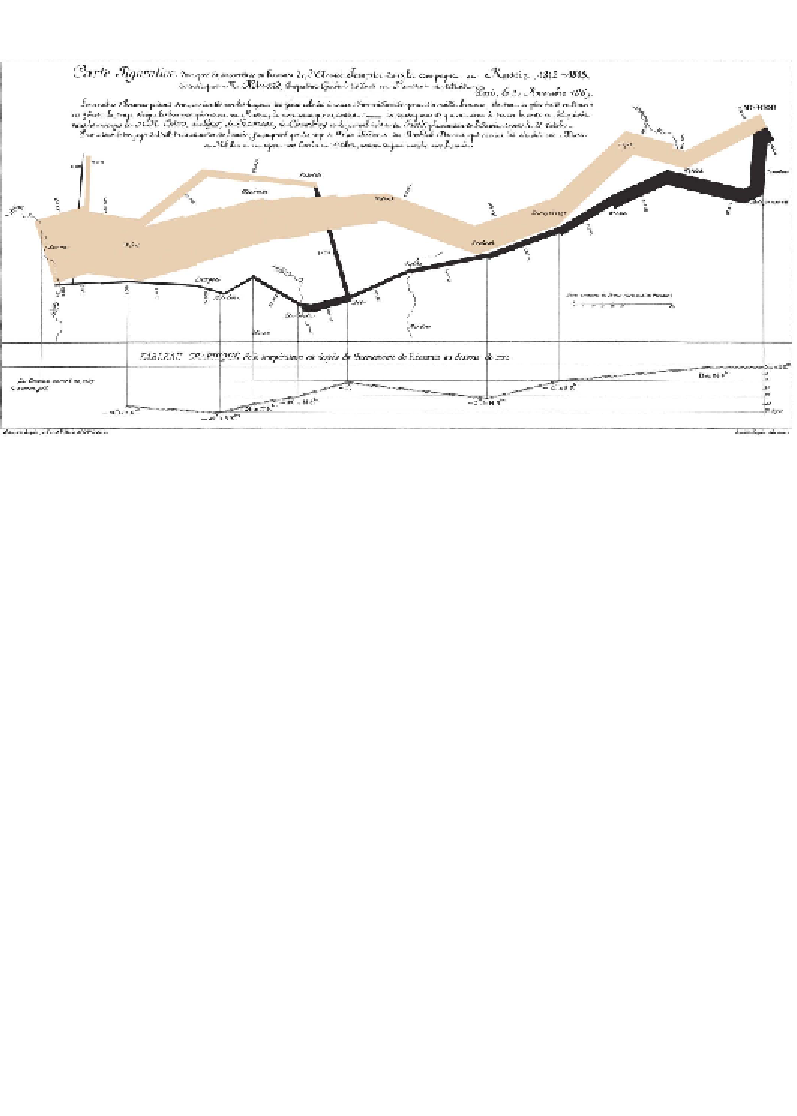
The following map shows Napoleon's famous Russian campaign:
Images republished from the freely licensed media file repository Wikimedia Commons, source:
http://commons.wikimedia.org/wiki/File:Minard.png
Plotting connections and relationships
We now look at the different visualization techniques used to plot connections
and relationships:
Scatter plot
Data variables
: 2 x quantitative.
Visual variables
: Position, color-hue.
Description
: A scatter plot is a combination of two quantitative variables plotted on
to the x and y axes in order to reveal patterns of correlations, clustering, and outliers.
This is a very important chart type, in particular, for when we are familiarizing with
and exploring a dataset. An sample scatter plot is shown in the following image:
Search WWH ::

Custom Search