Graphics Reference
In-Depth Information
Stream graph
Data variables
: 1 x quantitative-interval, 1 x categorical, 1 x quantitative-ratio.
Visual variables
: Height, area, color-hue.
Description
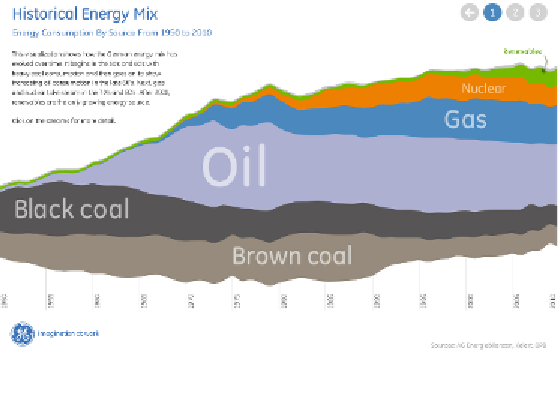
: The stream graph operates in a similar fashion to a stacked area chart,
allowing multiple values series to be layered as streams of area with quantitative
values expressed through the height of the individual stream at any given time.
It has no baseline x axis and so there is no concept of negative or positive values,
purely aggregates. Its functional purpose is really to highlight peaks and troughs—it
has a particularly organic feel and is suited to displays intended to show "ebb and
low" stories. Many stream graphs will offer interactivity to allow you to explore and
isolate individual layers. An example is shown in the following screenshot:
Image from "German Energy Landscape" (
http://visualization.geblogs.com/
visualization/germanenergy
), created by Gregor Aisch

Search WWH ::

Custom Search