Graphics Reference
In-Depth Information
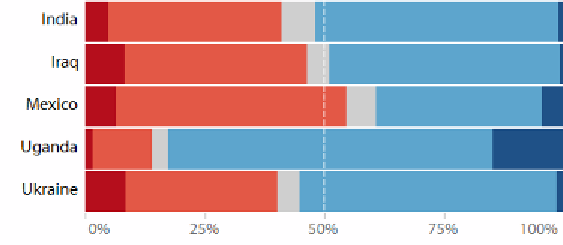
Square pie (or unit chart or waffle chart)
Data variables
: 1 x categorical, 1 x quantitative-ratio.
Visual variables
: Position, color-hue, symbol.
Description
: There are several titles for this type of chart but the common technique
involves a grid of units (may be squares or symbols) to represent parts of a whole.
This may be for a percentage comparison (square pie) or an absolute quantity (unit
chart, waffle chart). The use of color and symbol establishes the visual composition
of the categorical and quantitative values. An example is shown here:


Search WWH ::

Custom Search