Graphics Reference
In-Depth Information
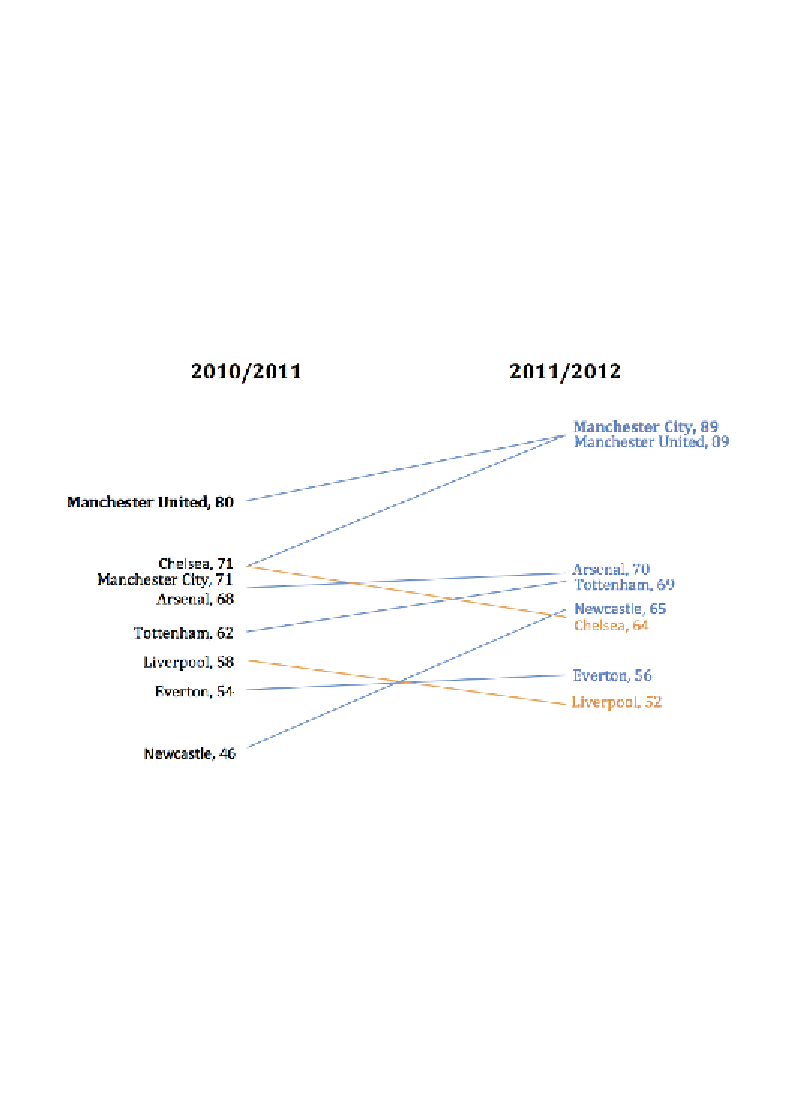
Slopegraph (or bumps chart or table chart)
Data variables
: 1 x categorical, 2 x quantitative.
Visual variables
: Position, connection, color-hue.
Description
: A slopegraph creates an effective option for comparing two (or more)
sets of quantitative values when they are associated with the same categorical value.
They especially provide a neat way of showing a before and after view or comparison
of two different points in time. In the following example, we see the total points won
for teams in the English Premier League across two comparable seasons. The layout
creates a combined view of rank and absolute value based on position on the vertical
axis, with a link joining the associated values to highlight the transitional change. Color
can be used to further emphasize upward or downward changes:
Radial chart
Data variables
: Multiple x categorical, 1 x categorical-ordinal.
Visual variables
: Position, color-hue, color-saturation/lightness, texture.
Search WWH ::

Custom Search