Graphics Reference
In-Depth Information
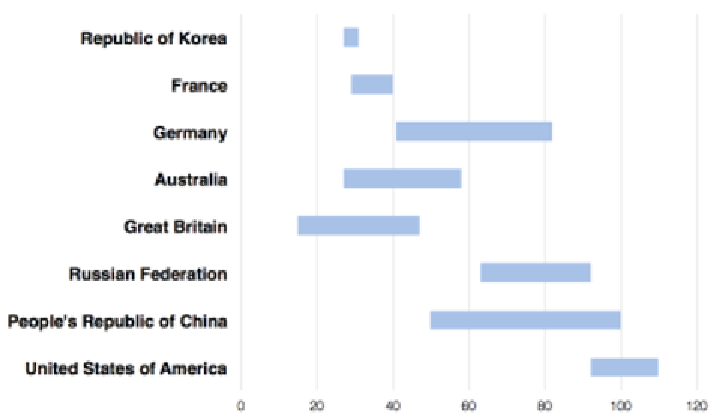
Description
: A floating bar chart—sometimes labeled a Gantt chart because of
similarities in appearance—helps to show the range of quantitative values. It
presents a bar stretching from the lowest to the highest values (therefore the starting
position is not the zero point). Using such charts enables you to identify the diversity
of measurements within a category and view overlaps and outliers across all
categories. A Gantt chart is shown in the following screenshot:
Pixelated bar chart
Data variables
: Multiple x categorical, 1 x quantitative.
Visual variables
: Height, color-hue, symbol.
Description
: The proposed name of "pixelated bar chart" is more an intuitive
description than an established type. These charts provide a dual layer of
resolution: a global view of a bar chart (showing aggregate totals) and a local
view of the detail that sits beneath the aggregates (demonstrated by the pixels
shown within each bar). Typically, these charts are interactive and offer an ability
to hover over or click on the constituent pixels/symbols to learn about the stories
at this more detailed resolution.


Search WWH ::

Custom Search