Biomedical Engineering Reference
In-Depth Information
a
b
10
18
9
16
8
14
7
12
6
10
5
8
4
6
3
4
2
2
0
1
0
0.2
0.4
0.6
0.8
1
20
40
60
80
100
Time (s)
Trials
d
10
c
9
150
8
100
7
50
6
5
0
4
−50
3
2
−100
1
−150
0
−150 −100 −50
0 0
100
150
−150 −100 −50
0 0
100
150
Azimuth direction (deg)
True Direction (deg)
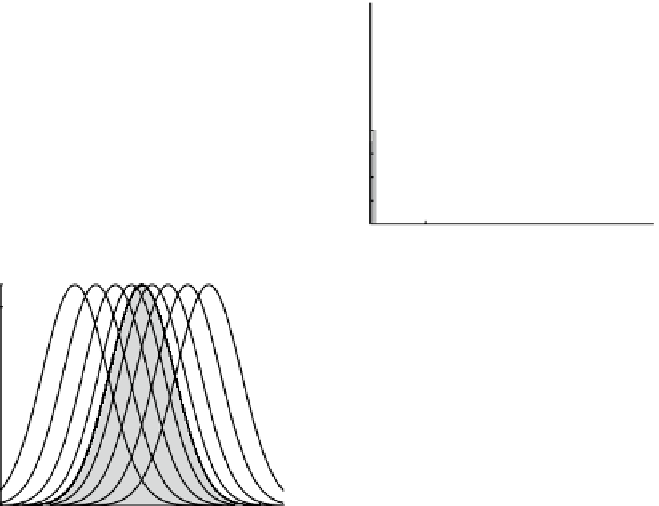
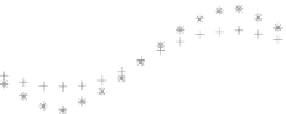
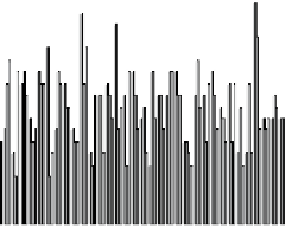
Fig. 4.3
Population vector (PV) estimate of sound source. (
a
) Raster plots of ten Poisson neurons'
spike trains with a spike rate of 10 spike/s over a 1 s trial. (
b
) Histogram of a single Poisson spiking
neuron' spike count across 100 trials (1 s long; 10 spike/s). (
c
)
Tuning curves
of nine neurons from
the neural population encoding model. The
grey tuning curve
has a preferred direction of 0
°
for the
sound source direction, with a peak iring rate of 10 spike/s. The preferred direction of the popula-
tion is normally distributed around 0
∘
[see Eq. (
4.10
)]. (
d
) Estimated azimuth as a function of true
(presented) azimuth based on the PV and the probabilistic population code (PPC, see Sect.
4.5
).
The
grey crossed curve
represents the PV estimate while the
grey starred curve
represents the
estimate obtained from the PPC (see Sect.
4.5
). The
dashed line
denotes ideal performance. The
black circled curve
represents the estimate obtained from the PV when the neuron's iring rates are
correlated (
ρ
= 0. 5, Sect.
4.6
). Note that the bias towards central positions exhibited by the PV
estimate is similar to that obtained from the PPC Bayesian Model (
nnetwork.m
)
ago in the superior colliculus and motor cortex to decode eye and arm movements
from experimentally determined neuronal iring rates. Figure
4.3
a shows the activ-
ity of ten Poisson neurons with spike rates of 10 spikes/s in a single trial (1 s long).
For such Poisson neurons, the distribution of the spike count,
k
, in each 1 s bin has
the form,
k
l
pk
()
=
e
−
l
,
(4.8)
k
!