Biomedical Engineering Reference
In-Depth Information
a
b
250
200
150
Sound
Source
Elevation
100
50
0
90º
0º
Azimuth
−50
−100
−150
−200
−250
−150
−100
−50
0
50
100
150
Azimuth direction (deg)
c
d
u
(θ)
150
posterior
0.03
θ
100
0.025
50
0.02
0
0.015
−50
0.01
prior
−100
0.005
likelihood
−150
0
−150
−100
−50
0
50
100
150
−150
−100
−50
0
50
100
150
Azimuth direction (deg)
True Direction (deg)
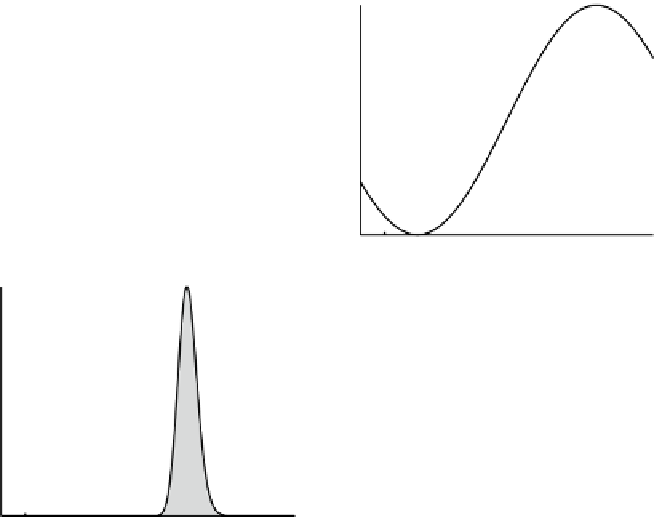
Fig. 4.2
Bayesian estimation of sound source. (
a
) Schematic illustration of the coordinate system
used to describe sound direction, characterized by azimuth and elevation angles. A sound source
with a horizontal direction or azimuth of 0
°
lies straight in front of the animal. A sound source with
an azimuth different from 0
°
will arrive at a different time at the two ears. (
b
) Model of ITD as a
function of azimuth itted from experimental data. The
dashed horizontal line
indicates zero ITD.
(
c
) The likelihood function or generative model for the
θ
,
p
(ITD |
θ
), is illustrated as the
dashed
black line
(ITD = 218. 9 ms). The
grey line
is the prior distribution expected by the owl, while the
black line
and
grey area curve
is the posterior probability distribution. The
dotted black line
repre-
sents the owl's sound source direction estimate (
ˆ
q
=
°
49 7
). (
d
) Estimated azimuth as a function
of true (presented) azimuth based on the model described in the main text. The
dotted line
denotes
model performance while the
dashed line
denotes ideal performance. Note the bias towards central
positions exhibited by the model. The
upper left inset
illustrates the relation between the azimuthal
angle
θ
and its associated unit vector
u
(
θ
) on the unit circle (
dashed
) (
bayesian.m
)
.
where
W
is a Gaussian random variable with zero mean and standard deviation
σ
g
= 41. 2 μs. This gives the generative model
1
2
2
−
(
ITD
−
A
sin(
wq
))/(
2
s
)
p
(
ITD
|
q
)
=
e
.
(4.5)
g
2
ps
g
The corresponding likelihood function is illustrated as the dashed curve of Fig.
4.2c
for a speciic value of the ITD. Notice that it is bimodal with two identical peaks.
Hence the owl cannot simply select from this model a single most likely
θ
, accord-
ing to the usual “maximum likelihood” principle.