Biomedical Engineering Reference
In-Depth Information
a
Difference in ERR
spectrogram of IC14
between Classes (1−2)
Difference in ERR
spectrogram of IC7
between Classes (1−2)
80
80
60
60
20
Baseline
40
40
20
20
-20
1
2
3
4
5
6
1
2
3
4
5
6
Time (sec)
b
Difference in ERR
dDTF from IC14 to
IC17
between Classes (1−2)
Difference in ERR
dDTF from IC7 to
IC14
between Classes (1−2)
80
80
60
60
40
40
20
20
1
2
3
4
5
6
1
2
3
4
5
6
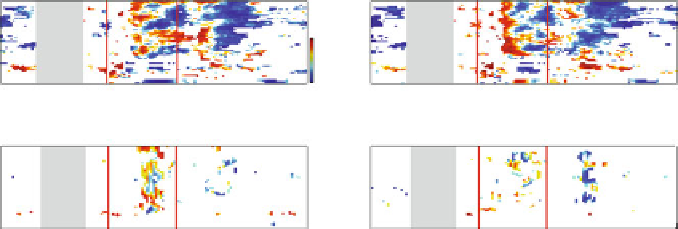
Fig. 3.3
Statistical signifi cance in spectrograms and dDTFs: (
a
) Signifi cant differences in
event-related responses (ERRs) in spectrograms between Classes 1 and 2. Examples from IC14
(
left
) and IC7 (
right
) are shown. ERRs were obtained by comparing each value to a baseline (
gray
)
for each frequency bin (a total of 65 bins from 0 to 100 Hz). Signifi cant ERRs from two classes
were then compared with each other. Signifi cant differences in ERRs are shown as a
z
-score, e.g.,
areas with
reddish colors
indicate that ERRs in Class 1 are signifi cantly greater than those in Class
2. Variables that were either not signifi cant ERRs or not signifi cantly different between two classes
are shown in
white
. The Bonferroni correction was used to test ERRs and differences in ERRs. The
two
red vertical lines
represent the onset of events, as in Fig.
3.1
. (
b
) Signifi cant differences in
ERRs in dDTFs between Classes 1 and 2. Examples of dDTF from IC14 to IC7 (
left
) and dDTF
from IC7 to IC14 (
right
) are shown. The methods and representations are as in (
a
)
measures activity features from multitrial data, leaving out a different trial each
time. This method is straightforward but usually requires a large number of trials for
practical applications.
The examination of the empirical distribution of each value in activity features
after bootstrapping or LOOM allows us to perform various statistical analyses: (1)
to test for signifi cantly nonzero features; (2) to test for signifi cant event-related
responses, i.e., features that are signifi cantly different from those in a baseline; and
(3) to test for signifi cant differences in features between experimental conditions.
As those tests are individually performed on each value of an activity feature, it is
important to correct for multiple comparisons, to acquire statistical signifi cance on
the complete feature. Two common correction methods are (1) the Bonferroni cor-
rection, which lowers the signifi cance threshold (e.g., 0.05) 1/
N
times, where
N
represents the total number of variables in the activity feature, and (2) false discov-
ery rate (FDR) (Benjamini and Hochberg
1995
), which controls the expected pro-
portion of incorrectly rejected null hypotheses (type I errors). Typically, FDR is less
strict than the Bonferroni correction while still maintaining control for multiple
comparisons. For our fear recognition data, we tested for signifi cant event-related
responses that are also signifi cantly different among classes. Examples from two
ICs (see Fig.
3.2
) are shown in Fig.
3.3
.