Biomedical Engineering Reference
In-Depth Information
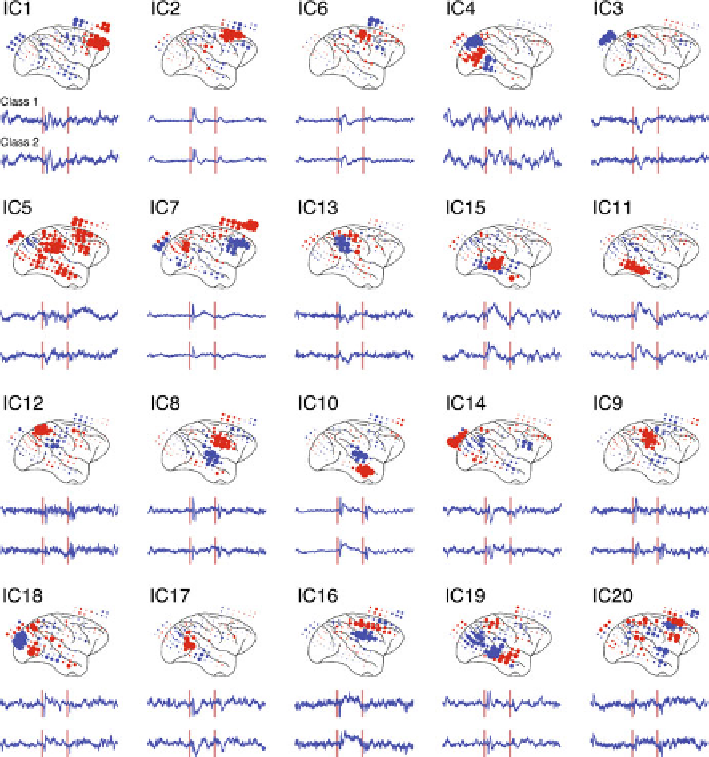
Fig. 3.2
ICA on the fear recognition data: ICs were acquired by implementing ICASSO with the
FastICA algorithm, with 20 ICs and ~75 % of variance explained. The spatial distribution of the
unmixing matrix of each component, which indicates how signals from different electrodes con-
tribute to the component, is shown on the top of each panel. The size of each dot represents the
normalized absolute contribution of each electrode to the component, and the color of each
dot
represents the corresponding sign (
red
, positive;
blue
, negative). The average IC across trials, or
the event-related potential (ERP) of each component, for each class is also shown. The two
red
vertical lines
represent the onset of events, as in Fig.
3.1
. Twenty ICs (IC1-IC20) are shown in the
order of the quality index representing the estimation reliability (Himberg et al.
2004
)
3.2.3
Connectivity Measures
The primary goal of connectivity measures is to identify relationships between
activities in different brain regions during information processing. Connectivity
measures can reveal the structural or anatomical connectivity of the brain and pro-
vide insights into how different brain regions integrate information, which is