Biomedical Engineering Reference
In-Depth Information
• Comparisons of commonly used techniques and highlights of their advantages
and shortcomings
• Demonstrations using data from our laboratory that are freely available
(neurotycho.org) (Nagasaka et al.
2011
)
• Useful software, MATLAB (The MathWorks, Inc.) toolboxes in particular, for
easier implementation
3.2
Offl ine Analysis
The goal of offl ine analysis is to extract characteristics in ECoG signals that are
statistically relevant to the neural processes of interest. In this section, we will go
through a routine step-by-step approach for identifying useful features from multi-
trial, multichannel ECoG data in a typical block-design experiment (Fig.
3.1
).
a
Subject watching
video clips
Class 1
Class 2
Waiting
(2.5 s)
Context
(1.5 s)
Emotion
(3 s)
b
1 mV
0
2.5
4
7
Time (s)
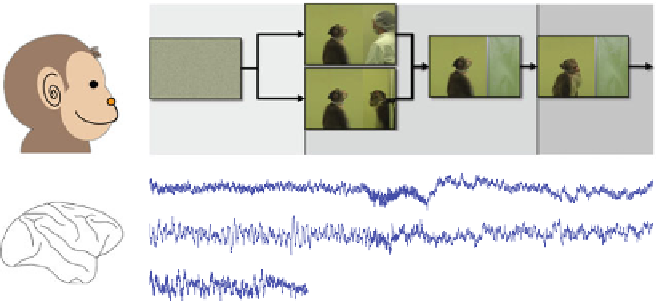
Fig. 3.1
Block-design experiment for social-context-dependent fear recognition: (
a
) The subject,
a Japanese monkey (
left
), was seated in front of a TV screen showing a series of 7 s movie clips
(
right
). Two types of clips were used, each consisting of three parts.
Waiting
period (2.5 s): only
white noise was shown.
Context
period (1.5 s): one of two types of social conditions was shown—a
monkey is threatened by a human (Class 1) or by another monkey (Class 2). At the end of this
period, a curtain was closed and only the monkey being threatened could be seen by the subject.
Emotion
period (3 s): the monkey being threatened in the
Context
period exhibited an expression
of fear. The two types of clips were played in random order and each was played a total of 100
times. The goal was to identify the differences in ECoG signals recorded in the subject watching
the same fear expression but under different social contexts, which should represent the neural
correlates of social-context-dependent fear recognition, i.e., how the subject perceives the fear
expression shown by another monkey based on different social contexts. (
b
) A 128-channel ECoG
array was implanted into the subject (
left
), which covered most of the right hemisphere, including
the medial wall in the frontal and the visual cortices (
black dots
). Voltage traces, sampled at 1 kHz,
of a randomly picked trial at three electrodes (
red dots
) are shown (
right
). The onsets of the
Context
and
Emotion
periods are indicated as two
red vertical lines