Biomedical Engineering Reference
In-Depth Information
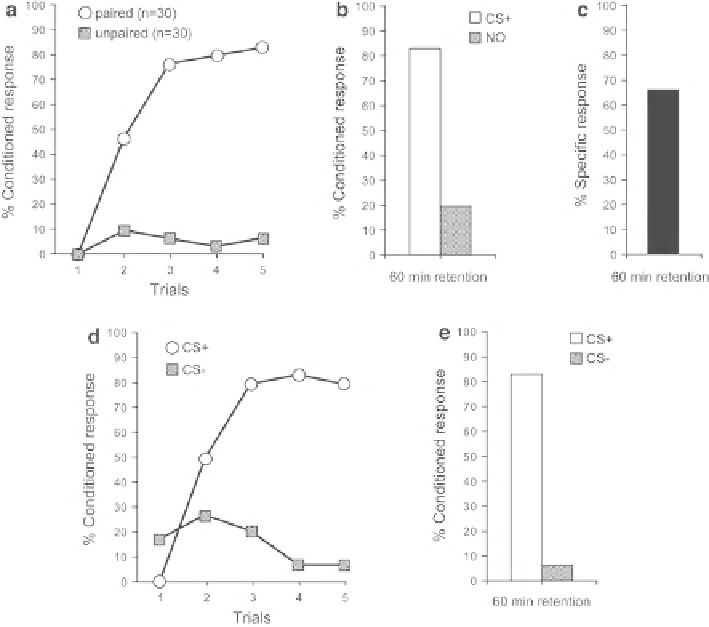
Fig. 2.3
Typical results of acquisition curves and retention tests. (
a
) Acquisition curves for hon-
eybees trained by paired conditioning (
white circle
) or unpaired conditioning (
gray square
). For
each conditioning trial, conditioned response (%CR) is calculated as percentage of bees that
showed PER to the conditioned odor. (
b
,
c
) Memory retention tests for honeybees trained by paired
conditioning. For the test 60 min after conditioning, both CR for a conditioned odor (CS+:
white
graph
) and CR for a novel odor (NO:
gray graph
) are plotted in (
b
), and specifi c response (%SR:
black graph
, see text) are calculated and plotted in (
c
). (
d
) Acquisition curves for honeybees
trained by differential conditioning. (
e
) Memory retention tests for honeybees trained by differen-
tial conditioning
2.3.10
Data Analysis
To analyze acquisition within a single group, a Cochran
Q
test can be used as it is
especially conceived for a repeated-measures experimental design with a dichoto-
mous variable. To compare acquisition performances between two or more different
groups (e.g., paired vs. unpaired groups; see above), Mann-Whitney
U
tests can be
used on the sum of responses to the CS observed during conditioning. Yet, this
method has the disadvantage of losing the dynamics of an acquisition curve as it
reduces it to a single data point. A similar criticism applies to the use of Fisher exact