Information Technology Reference
In-Depth Information
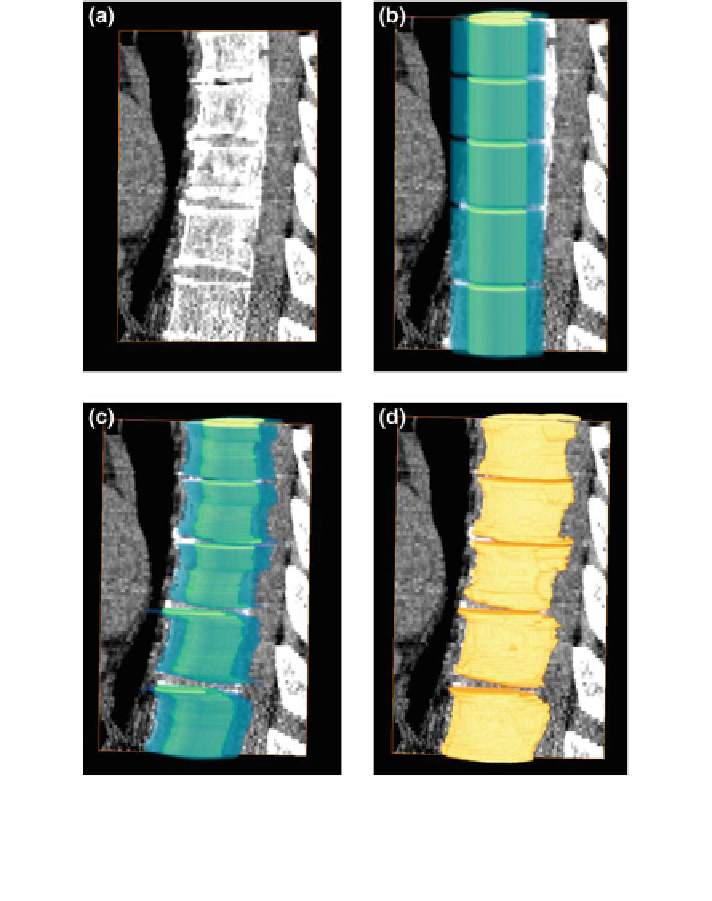
Fig. 26 The shape embedding and
final segmentation results are shown in 3D views. a A CT data
is shown in the sagittal axis (without the re
nement). b The initial location of the shape models.
2D shape models are propagated in z-axis to form 3D models. The blue color (outer volume)
shows the variability region, whereas the yellow color (inner volume) represents the object region.
c The shape model after registration. d The
final segmentation results using the three models
model [
34
]. Where the distance marginal densities of the VB and its background
inside the variability region are approximated using a Poisson distribution, which is
re
ned by positive and negative Gaussian components. In order to use this distance
probabilistic model with any given VB set of images, we align this given volume
with the training 3D shape. The second step is approximating VB
is gray level using
our linear combination of Gaussian distributions (LCG) model with positive and
negative components [
35
,
36
]. Moreover to model the spatial relationships between
'