Information Technology Reference
In-Depth Information
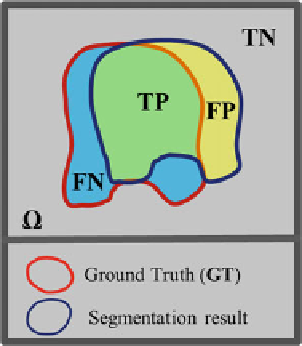
Fig. 17 In the segmentation
quality measurements, there
are 4 regions to be considered
as: True positive (TP), false
positive (FP), true negative
(TN), and false negative (FN).
The reference and test regions
represent the ground truth and
automatic segmented regions
using the Jaccard distance whereas for the clinical data sets, the segmentation
quality is measured using 4 difference formulations. The measurements can be
de
ned as follows:
TP
þ
TN
Accuracy
ð%Þ
¼
100
ð
26
Þ
TP
þ
FP
þ
FN
þ
TN
TP
Precision
ð%Þ
¼
100
ð
27
Þ
TP
þ
FP
TP
ð%Þ
¼
ð
Þ
Jarrardcoefficient
100
28
TP
þ
FN
þ
FP
2TP
2TP + FP + FN
Dice
0
scoefficient
ð%Þ
¼
ð
Þ
100
29
2.4.9 Experimental Results-Validation Using the Phantom
In the experiments, the ESP, which is an accepted standard for quality control [
3
]in
bone densitometry, is used to validate the segmentation algorithms. Because clinical
CT images have gray level inhomogeneity, noise, and weak edges in some slices,
the ESP was scanned with the same problems to validate the robustness of any
method. CT images may have various noise and image uncertainties. Image noise is
related to the numbers of X-ray photons absorbed by each small area of the image
[
31
]. The higher exposure levels result in a better image, and less image noise, but
more radiation is absorbed by a patient. Hence, segmentation methods should be
robust to various image conditions. It is assumed that CT images may have random
noise. To assess the proposed method under various challenges, Gaussian noise
with a zero mean and different variance
r
n
values (from 0 to 0.5) is added to the CT