Information Technology Reference
In-Depth Information
Figure
12
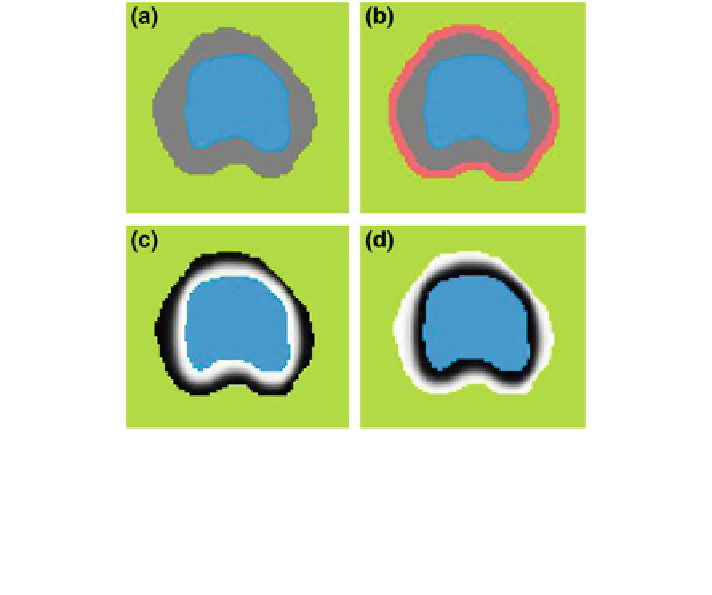
shows the detailed description of the shape models. The green color
shows the background region (
) which does not have any intersection with any
training shape. The blue color shows the object region (
B
) which is the intersection
of all training shapes. In (a), the gray color represents the variability region (
O
) that
can be described as the union of all projected training shapes subtracted by the
intersection of those shapes. In this variability region, the object and background
probabilistic shapes are modeled. The red color, in (b), shows the outer contour of
the variability region, and it is represented as (J). In the registration step, the shape
model is embedded to the initially segmented region. J is used to estimate the
registration parameters. The object (p
V
ð
d
j
f
¼
1
Þ
) and background (p
ð
d
j
f
¼
0
Þ
)
probabilistic models are de
ned in the variability region. The probabilistic shape
models are de
ned as follows:
If x
2O
, then p
ð
d
x
j
f
x
¼
1
Þ
¼
1 and p
ð
d
x
j
f
x
¼
0
Þ
¼
0
if x
2B
, then p
ð
d
x
j
f
x
¼
1
Þ
¼
0 and p
ð
d
x
j
f
x
¼
0
Þ
¼
1
if x
2V
, then
Fig. 12 The shape model. The green color shows the background region which does not have any
intersection with any training shape. The blue color shows the object region which is the
intersection of all training shapes. a The gray color represents the variability region that can be
described as the union of all projected training shapes subtracted by the intersection of those
shapes. In this variability region, the object and background probabilistic shapes are defined. b The
red color shows the outer contour of
the variability region. c The object
ðpð
d
j
f ¼ 1
ÞÞ
.
d background
ðpð
d
j
f ¼ 0
ÞÞ
shapes are modelled in the variability region in which the pixel values