Information Technology Reference
In-Depth Information
Fig. 3 a The template used for the Matched
filter. b
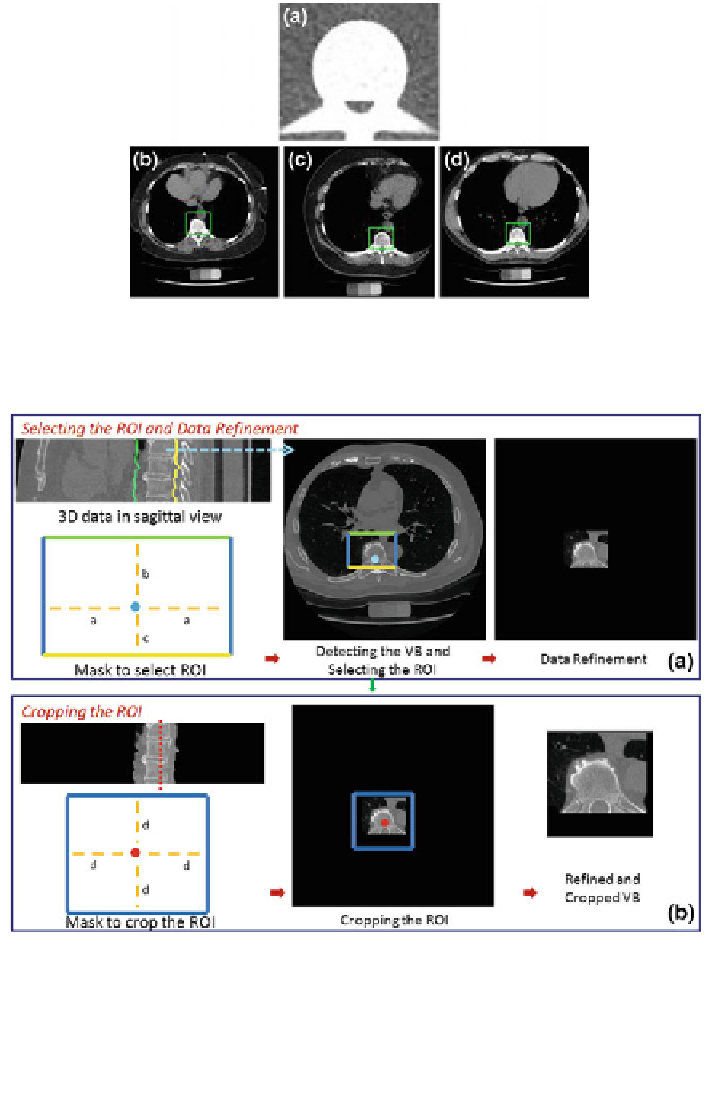
d A few images of automatic VB detection.
-
The green line shows the detection of VB region
Fig. 4 In the first step, the MF is run on each slice of the 3D data. The output of this process is the
detected points of each CT slices as shown with the blue dot. After the center points are detected, a
mask is used to re
ne the data to specify the region of interest (ROI). In the mask, it is accepted
that
c
¼
20. Any user can change these values. But the user should be careful
to extract the spinal processes and ribs roughly. Then, another mask can be used to crop the ROI
using the average center points (the red color) of all slices of 3D data.
a
¼
50,
b
¼
60, and
d
¼
60 is accepted to
capture the VB region