Information Technology Reference
In-Depth Information
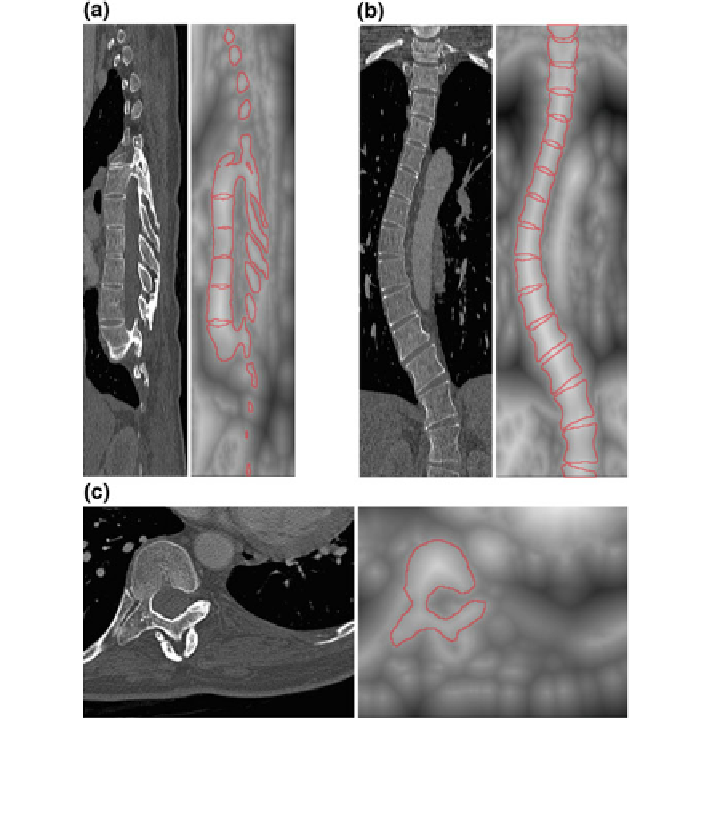
Fig. 9 Original image I (left) and the corresponding distance transform D
I
with superimposed
spine boundaries (right), displayed for a selected a sagittal, b coronal and c axial cross-section of a
3D CT image of a scoliotic spine. In the distance transform D
I
, brighter elements represent
positive distances, while darker elements represent negative distances
In order to increase the optimization robustness, two additional mechanisms can
be applied. First, the amount of information taken into account during optimization
can be increased by considering distance map values within a radius from the spine
curve, which can be de
ned from the quantitative morphometrical vertebral anal-
ysis [
52
54
]. Second, optimization can be designed hierarchically and performed
on multiple levels. On the
-
first level, the polynomial functions are initialized with
degrees of K
x
¼
1, i.e. as straight lines. When the optimization reaches
the termination criterion, polynomial degrees are increased by 1 and the optimi-
zation is restarted on the next level, using the polynomial parameters from the
previous level for initialization (optionally, the degree of the polynomial function
c
z
ð
K
y
¼
K
z
¼