Information Technology Reference
In-Depth Information
without the score of 1 which does not represent syndesmophyte growth. The scores
were: 0 = no syndesmophyte; 2 = syndesmophyte but not complete bridging;
3 = bridging. Results from the 4 IDSs were added. Figures
15
and
16
show
examples of syndesmophyte progression detected by the algorithm but not visible
on radiographs from baseline to year 1 and 2 respectively.
The mean (
186) mm
3
±
std) computed syndesmophyte volume change was 87 (
±
366) mm
3
at year 2, which respectively represents an increase
of about 8 and 18 % in respect to the mean baseline volume. At year 1 and 2,
respectively 24 (73 %) and 26 (79 %) patients had a volume increase. By contrast,
at year 1 and 201 (
±
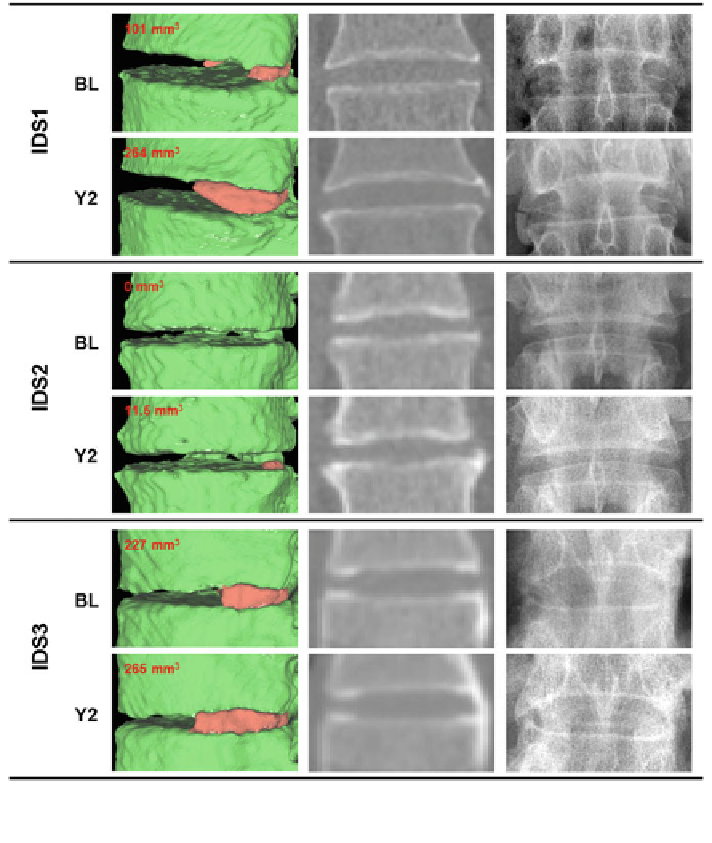
Fig. 16 Examples of syndesmophyte progression from baseline (BL) to year 2 (Y2). From left to
right 3D surface mesh (syndesmophytes in red and vertebral bodies in green), CT slice, radiograph