Information Technology Reference
In-Depth Information
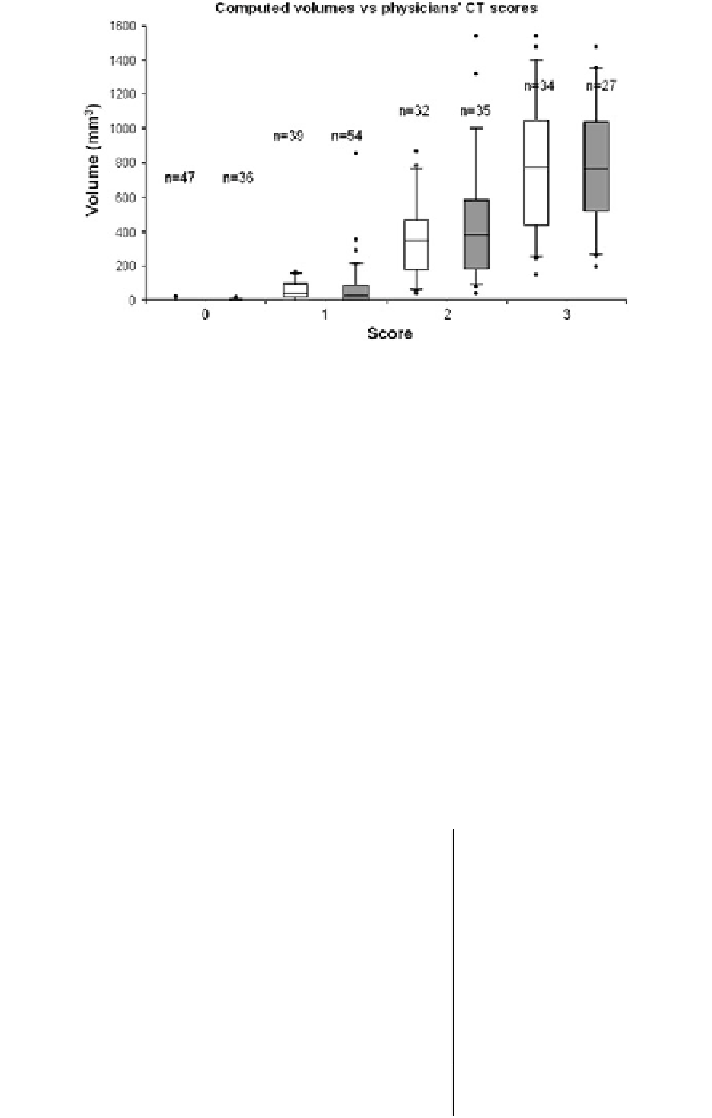
Fig. 14 Boxplots of computed syndesmophyte volume and height by physicians
'
scores (white for
one reader, grey for the other). N is the number of intervertebral disc spaces
the
first scan, patients stood up before lying down again for the second scan. This
ensured that they did not lie in exactly the same position and that the variation was
in the range expected for patients in a longitudinal study. That enabled us to include
the variability originating from CT artifacts such as beam hardening [
58
]. Syn-
desmophyte volumes from the 4 IDSs were added to form a total per patient.
Various measures of reliability were computed (Table
1
). The mean (
±
std)
19.6) mm
3
, only represents 1.31 % of the
total mean syndesmophyte volume, 1,396 (
difference between the two scans, 18.3 (
±
1,564) mm
3
. The intraclass correlation
±
coef
cient of variation (CV) was estimated
according to the guidelines of Gluer et al. [
59
]. Bland-Altman analysis was used to
determine the 95 % limits of agreement [
60
]. Volume measures were heterosked-
astic, with larger
cient (ICC) was very high. The coef
inter-scan differences for
larger syndesmophyte volumes.
Bland
Altman analysis was therefore performed on log-transformed values, and the
-
Table 1 Reliability/precision
of computed syndesmophytes
volumes
Syndesmophyte volumes
1st scan
2nd scan
Min (mm
3
)
55.4
55.5
Max (mm
3
)
4,333
4,292
std (mm
3
)
Mean
±
1,396
±
1,564
1,404
±
1,564
Reliability measures
Mean
±
std of difference
(mm
3
)
18.3
±
19.6
ICC
0.99
CV (%)
1.31
95 % limits of agreement
(%)
[
−
0.30, 0.30]