Biomedical Engineering Reference
In-Depth Information
Figure8.1
Opticalmicrographofwholecellulosefibersisolatedfrombagasseafterpulping.
Reprintedfrom(14).Copyright(2008),withpermissionfromElsevier.
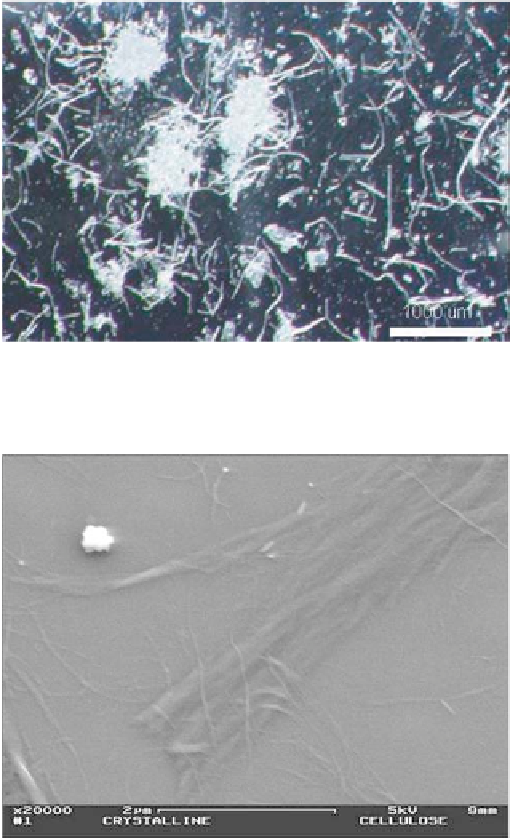
Figure8.2
Scanningelectronmicrographshowing thepresenceof the individual cellulose
microfibers obtained frombagasse. Reprinted from(14). Copyright (2008), withpermission
fromElsevier.
bundles from which the microfibers were released after hydrolysis, ultrasonication and
homogenization, can be seen in Figure 8.2.
A broad distribution of fiber lateral dimensions is evident, owing to the fact that
some of the microfibrillar bundles were not completely dispersed and/or re-aggregated
during the preparation of samples for scanning electron microscopy (SEM) and atomic
force microscopy (AFM) studies. Depending on their origin, cellulose microfibrils may
have transverse dimensions that range from 20-200 nm but these particles are often
aggregates, and the individual microfibrils are usually in the range of 3-20 nm (15).
Search WWH ::

Custom Search