Biomedical Engineering Reference
In-Depth Information
2000
1.3 M
1500
1.2 M
1000
1.1 M
500
1.0 M
0
0
10
20
30
40
Time (min)
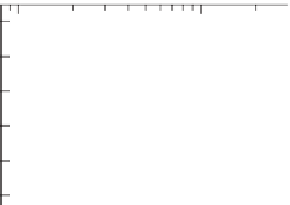
Figure 7.5
Hydrodynamic diameter of KL aggregates as a function of time and sodium
chlorideconcentrationat3.210
−4
MOH
−
(pOH3.5)and70
◦
C.Reprintedwithpermission
fromNorgrenetal. (2002).Copyright(2002),AmericanChemicalSociety.
10
5
10
4
10
3
10
2
CCC
10
1
QELS
Turbidity
10
0
0.1
1.0
[NaCl] (M)
Figure7.6
Stabilityratioof unfractionatedKLas a functionofNaCl concentrationat pOH
3.5 and 70
◦
C. The CCC is 1.3 M. Reprinted with permission fromNorgren etal. (2002).
Copyright(2002),AmericanChemicalSociety.
alkaline conditions and different sodium chloride concentrations, as indicated in the
figure legend. At higher ionic strengths, very large aggregates are formed. Consequently,
some samples are found to be settling during the time of experiment.
In the interval
1
.
3
[NaCl]
<
1
.
5 M, the aggregation curves are overlapping. At a sodium chloride
concentration of 1.5 M, samples start to phase-separate already at room temperature.
The results obtained from the early-time kinetic data in Figure 7.5 as well as some
supplementary results from turbidity measurements were used in the calculations of sta-
bility ratios (
W
) for the Indulin AT system at 3
.
210
−
4
MOH
−
(pOH 3.5) and 70
◦
C.
In Figure 7.6, a plot of the
W
-ratio as the function of sodium chloride concentration is
displayed. The onset of KL aggregation (coagulation) is found in the interval 0.2-0.7 M.
Sometimes, the electrolyte concentration at the onset of aggregation is defined as CCC
(Lindstr om 1980). In its strictest definition, however, the CCC is obtained at the intersec-
tion between still reaction-limited and purely diffusion-limited cluster-cluster aggregation
(Reerink and Overbeek 1954, Evans and Wennerstr om 1994).
As mentioned earlier, the RLCA and DLCA aggregation processes are universal, and
known to give aggregates of fractal geometry (Lin
et al
. 1989).
≤
This is also the case


Search WWH ::

Custom Search