Biomedical Engineering Reference
In-Depth Information
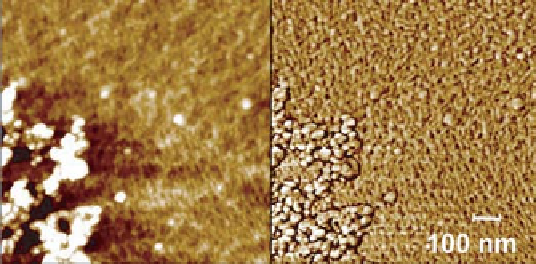
Figure 6.3
AFM topography (left) and phase contrast (right) images of xylan on cellulose
afterQCMadsorptionmeasurement. Imagesizeis1
µ
m
×
1
µ
m.
more rigid layer resulting in lower adsorption (Figure 6.1); see also Tammelin
et al
.
(2007).
3. Neutral GGM adsorbs on cellulose forming a dissipative layer whereas pectin with
low
M
w
and high anionic charge and small pectin formed thin, flat and rigid layer
on cellulose (Figure 6.1); see also Tammelin
et al
. (2007).
4. Xylan adsorbed on cellulose as notable amounts at low ionic strength. Increase in
ionic strength leads to lower frequency change (lower mass change on the crystal)
and higher dissipation change (Figures 6.1 and 6.2). This was not expected since an
increase in ionic strength should facilitate adsorption of more xylan on the surface.
Screened repulsion of anionic charges between the cellulose surface and xylan as well
as between anionic charges within the xylan molecule should lead to more pronounced
adsorption behavior, see also Paananen
et al
. (2003).
5. The large changes in dissipation for most of the systems indicate the formation of
viscoelastic hemicellulose layer and thus, the use of the Voigt model is motivated.
Figure 6.3 shows the AFM topography and phase contrast images of cellulose coated
QCM-D crystal surface after the adsorption of xylan from 100 mg g
−
1
solution at pH 10
and 1 mM NaCl. The fine structure of the cellulose surface can be seen in both images
as described in Tammelin
et al
.
(2006).
Granular shapes are interpreted to be xylan
aggregates.
6.5.2
Viscoelastic Properties of the Hemicellulose Layers
To further characterize the properties of the adsorbed hemicellulose films and the effect of
substrate and ionic strength on the film properties, the formed layers were analyzed using
the Voigt-based model for viscoelastic solid. The authors would like to point out that
too much significance should not be attached to the absolute values of shear viscosity,
elastic modulus and hydrodynamic thickness. On the contrary, the modeling results can
be compared relative to each other thus giving information on how the layer properties
are affected by parameters such as ionic strength and charge of the polyelectrolyte.
Figure 6.4 shows an example of the measured and fitted frequency and dissipation
change curves for the adsorptions of 100 mg l
−
1
hemicellulose solutions isolated from
Search WWH ::

Custom Search