Biomedical Engineering Reference
In-Depth Information
was increased. This was expected since previous investigations (34) have shown that
the adsorbed amount usually is increased when the salt concentration is increased. This
is probably due to the adsorption of the polymers with a larger number of loops and
tails due to the higher electrostatic screening when the salt concentration is increased.
The formation of PEMs from the two weak polyelectrolytes PAH and PAA is highly
sensitive to the pH. By using different combinations of pH during the formation, PEMs
with thicknesses varying from 10 to 120 A have been formed (16). A large difference
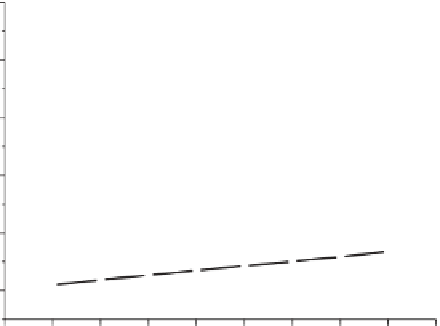
between PEM formation on silicon oxide has also been shown for PAH/PAA at pH
7.5/7.5, 5/5 and 7.5/3.5 (19), the adsorption being greater at pH 7.5/3.5 (Figure 5.5).
Figure 5.6 shows that there is also a significant increase in signal when the PEM is
formed from a combination of high molecular mass PAH/PAA.
According to the standard procedure in our group for the evaluation of PEM formation,
the PEMs from low molecular mass PAH/PAA (19) and high molecular mass PDAD-
MAC/PSS (35) were also studied with the aid of Quartz Crystal Microbalance with
dissipation(QCM-D), which makes it possible to measure both the frequency change
and simultaneously the energy dissipation in the adsorbed layer, which is (as mentioned
earlier) a measure of the rigidity of the film.
The dissipation values for PEMs of PAH/PAA adsorbed at pH 7.5/3.5 were signifi-
cantly higher than those for PDADMAC/PSS. When 7 layers of PDADMAC/PSS were
adsorbed, there was an increase of about 1.5 units compared to about 4 units with PAH/
PAA, indicating that PAH/PAA forms layers with a lower shear elasticity and lower vis-
cosity. For both systems there was also a difference in dissipation depending on which
polymer was adsorbed in the outermost layer (see also Figure 5.3), i.e. a higher dissi-
pation was also found when the cationic polyelectrolyte was adsorbed in the outermost
0.5
0.4
pH 7.5/7.5
pH 7.5/3.5
pH 5/5
0.3
0.2
0.1
0.0
0
1
2
3
4
5
6
7
8
9
Number of layers
Figure 5.5
Reflectometry data showing the relative change in the reflected signal (
S/S
0
)
whenaSiO
2
surfacewasconsecutivelytreatedwithPAH/PAA(15,000/5000)atabackground
electrolyteconcentrationof0.01MNaCl.ThePEMswereformedatpH7.5/7.5,7.5/3.5and
5.0/5.0respectivelyandthesaturationsignalforeachadsorbedlayerwasrecordedwhenthe
addedpolyelctrolytehadbeenadsorbedfor30s.Datafrom(27).


Search WWH ::

Custom Search