Biomedical Engineering Reference
In-Depth Information
1.6
1.4
1.2
PAH
PAA
PAH
1
0.8
0.6
Rinse
0.4
0.2
0
0
1000
2000
3000
4000
5000
Time (s)
(a)
50
PAH pH 7.5/PAA pH 7.5
Rinse
0
−
50
−
100
PAH
PAA
PAH
150
−
−
200
0
1000
2000
3000
4000
5000
6000
Time (s)
(b)
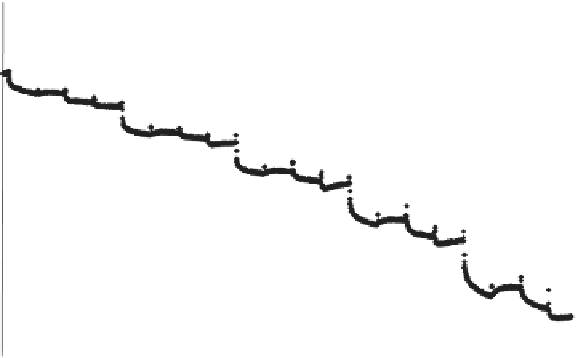
Figure 5.3
Typical results from SPAR and QCM-D measurements as functions of time
withcombinationsof PAH/PAAlowmolecularmass polyelectrolytes (15,000/5000) toSiO
2
surfaces at a pH
7.5 for both polyelectrolytes. (a) SPAR data corresponding to the solid
amountofadsorbedpolyelectrolyte;(b)QCM-Dfrequencydatacorrespondingtotheadsorbed
amount includingimmobilisedliquid; and(c)QCM-Ddissipationdatacorresponding tothe
visco-elasticpropertiesof theadsorbedlayers.Datafrom(19).
=


Search WWH ::

Custom Search