Biomedical Engineering Reference
In-Depth Information
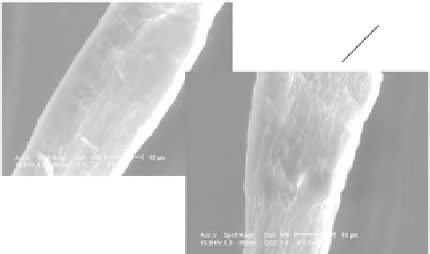
Non-treated
Treated
Figure5.2
ESEMimagesofsectionsofanuntreatedbleachedchemicalsoftwoodfibreanda
sectionofthesamefibretreatedwith5.5bilayersofPAH/PAA.Reprintedfrom(29).Copyright
(2006),withpermissionfromElsevier.
preceded by model experiments by using Stagnation Point Adsorption Reflectometry
(SPAR) (31, 32) where the adsorbed amount in g/m
2
can be estimated and by Quartz
Crystal Microbalance (QCM) (19, 33) measurements where the adsorption in g/m
2
can
be determined as a combination of the adsorbed amount of polymer and the amount of
water immobilized by the adsorbed layer. The QCM-D technique also makes it possible
to determine the energy dissipation into the system when the driving current to the quartz
crystal is stopped. A high energy dissipation indicates a layer with a low viscosity and
a low elastic modulus (33), and this information is important for the interpretation of
the influence of the multilayers on the adhesion between treated surfaces.
In both the SPAR and QCM experiments, we have chosen to work with SiO
2
surfaces
since these can be prepared in a well-defined way and, as earlier shown (31), these
surfaces can serve as an acceptable model surface for bleached chemical fibres whose
interaction with oppositely charged polyelectrolytes is dominated by charge interactions.
It is thus possible with these model experiments to estimate how the formation of PEM
on fibres depends on the charge density of the surface/polyelectrolyte and also on the
electrolyte concentration in the solution. It is also possible to derive molecular infor-
mation from the model experiments that is difficult, if not impossible, to obtain from
adsorption measurements with fibres. Naturally the extrapolation from SiO
2
surfaces
to fibres must be treated with care and with proper consideration of what is known in
the adsorption literature. The ideal situation would be to use model cellulose surfaces
in both these type of model experiments. Developments in our laboratory have shown
that this will be possible provided that the swelling and deswelling of the cellulose
layers upon adsorption can be quantified in a proper way to quantify the adsorption of
polyelectrolytes.
An example of the usefulness of combining SPAR and QCM-D measurements is
shown in Figure 5.3 (19) where the adsorption of PAH and PAA on SiO
2
surfaces is
shown.
The SPAR data shown in Figure 5.3a indicate that there is a steady build-up of PEM
for each consecutive layer whereas for the PAA there seems to be a small decrease in
the signal after it passes through a maximum for each PAA layer. This can both be due
to desorption of polyelectrolyte or due to a restructuring of the polyelectrolytes in the


Search WWH ::

Custom Search