Biomedical Engineering Reference
In-Depth Information
8
0.1 mM NaCl
1 mM NaCl
10 mM NaCl
100 mM NaCl
1000 mM NaCl
7
6
5
4
3
2
1
0
0
5
10
15
20
25
30
35
40
−D
f
(Hz)
Figure4.11
D
−
f profilesforpolyampholyteadsorptiononcellulosesurfacesatdifferent
ionicstrengths. Thehighchargedensitypolyampholyteconsistedof20%cationicand16%
anionicgroups.
1.2
Injection
Artifact
1
0.8
0.6
0.4
0.2
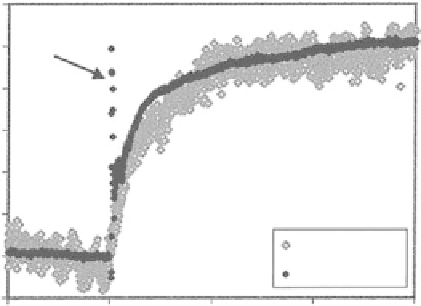
QCM Kinetics
0
SPR Kinetics
−
0.2
0
500
1000
1500
2000
Time (s)
Figure 4.12
Comparison of adsorption kinetics of a perfluoropolyether lubricant (Fomblin
ZDOL)depositedonsilversurfacesasmeasuredbySPRandQCMtechniques.Reprintedwith
permissionfromBailey,Kambhampatietal.Copyright(2002)AmericanChemicalSociety.
2002). However, since the two techniques rely on fundamentally different principles
of physics, namely optical and electromechanical, a more complete perspective of the
adsorption phenomena can be achieved by combining them. Figure 4.12 illustrates an
example to demonstrate how QCM and SPR data can be combined to study the kinetics
of adsorption of a thin organic film.
In this case both curves agree with each other
very well.


Search WWH ::

Custom Search